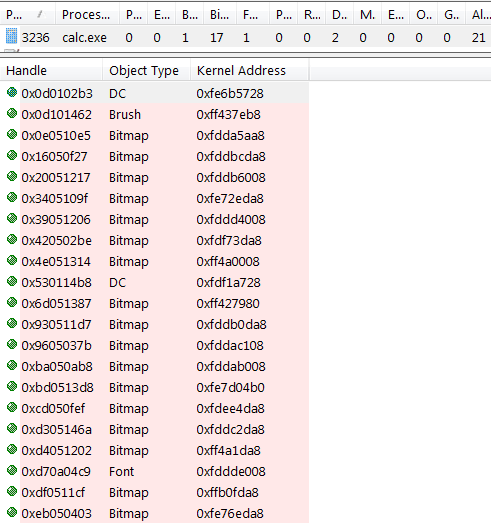
I'm debugging a potential GDI Handle Leak. Thanks to @Alois Kraus, there is a WinDbg script which performs a handle count.
From my debugging sessions, especially for .NET, I find that usually, it's better to have 32-bit dumps of 32-bit processes and 64-bit dumps of 64-bit processes.
Unfortunately, with 2 crash dumps I received, the script does not work. Looking deeper into it, I found out that the GdiSharedHandleTable is null in those dumps:
0:000> dt ntdll!_PEB GdiSharedHandleTable @$peb
   +0x094 GdiSharedHandleTable : (null)
Now, on his website, Alois mentions
Important: If you are running on a 64 bit OS you need to attach the 64-bit Windbg even if you debug a 32-bit application!
Unfortunately, using 64-bit WinDbg on the 32-bit crash dump does not help. The result is still the same.
Now here's a theory:
- some DLLs in a 32-bit process are 64 bit DLLs (see Windows Internals 5, Chapter 3, "System mechanisms," page 211)
ntdllis one of them (it is loaded twice, in the 64-bit version and the 32-bit version)- While GDI objects are user objects (and not kernel objects), they still need to be painted, etc. by the OS. Therefore it could be required that they are managed in the WOW64 layer
- This would mean that I have to have a WOW64 crash dump to make it work
So my question is: do I have the seldom case here that I need a WOW64 crash dump? A more detailed explanation of my theory would be great. If there's a good explanation in some book already, a reference to the chapter is enough. I'll buy it if I don't have it yet.


dd @@c++(@$Peb->GdiSharedHandleTable)returns00000000 00000000, so it's null and the script should not work. However, when you run the script, it returns correct results. This seems to be a contradiction to me. – Rounce