Adding headers IN table in flextable
Asked Answered
B

2

9

I am trying to use flextable to make a nice table that knits into word, with descriptive banners/headers through out

Example data:

trialdata<-structure(list(` ` = c("Number per team", "Average height", "vegetarian", 
"meat", "carrot", "cucumber", "orange", 
"banana", "pepper", "tangerine", "Average Score", 
"Range Score", "Number of children", "Number of parents", 
"Number of grandparents"), `year 1` = c("20", "2", 
"25", "12", "4", "7", 
"7", "37", "21", "3", 
"-0.3", "78 : 1", "61", "19", 
"39"), `Year 2` = c("98", "28.2", "23", 
"1", "8", "6", "1", 
"36", "2", "29", "-0.2", "3 : 2", 
"6", "18", "9"), `Year 3` = c("88", 
"28.2", "24", "1", "1", "4", 
"91", "3", "24 ", "2", 
"-0.2", "7 : 2", "58", "1", 
"8")), class = c("tbl_df", "tbl", "data.frame"), row.names = c(NA, 
-15L))

Make a table:

  install.packages("flextable")
library(flextable)
table1<-flextable(trialdata)

That makes a table which looks like the below picture, with a single header table looks like
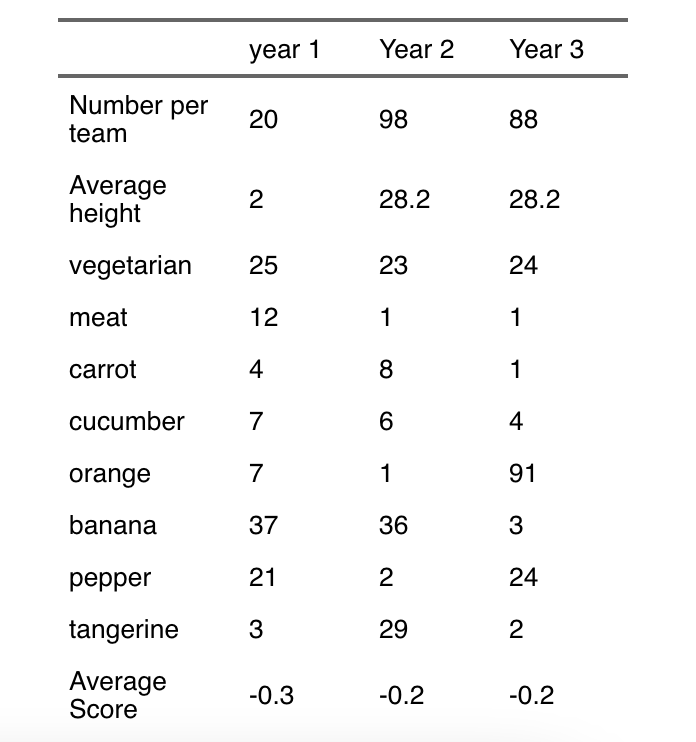
However I would like to add some kind of descriptive header, e.g.'favorite food'. This is not a 'grouping' already in the data, but an added text I would like to make the table clearer, for example to look like this:

Ideal tabke

Flex table has ways to add headers and footers, but I can't see a way to add a header-type object in the table.

Baggywrinkle answered 8/2, 2022 at 22:57 Comment(0)
D
4

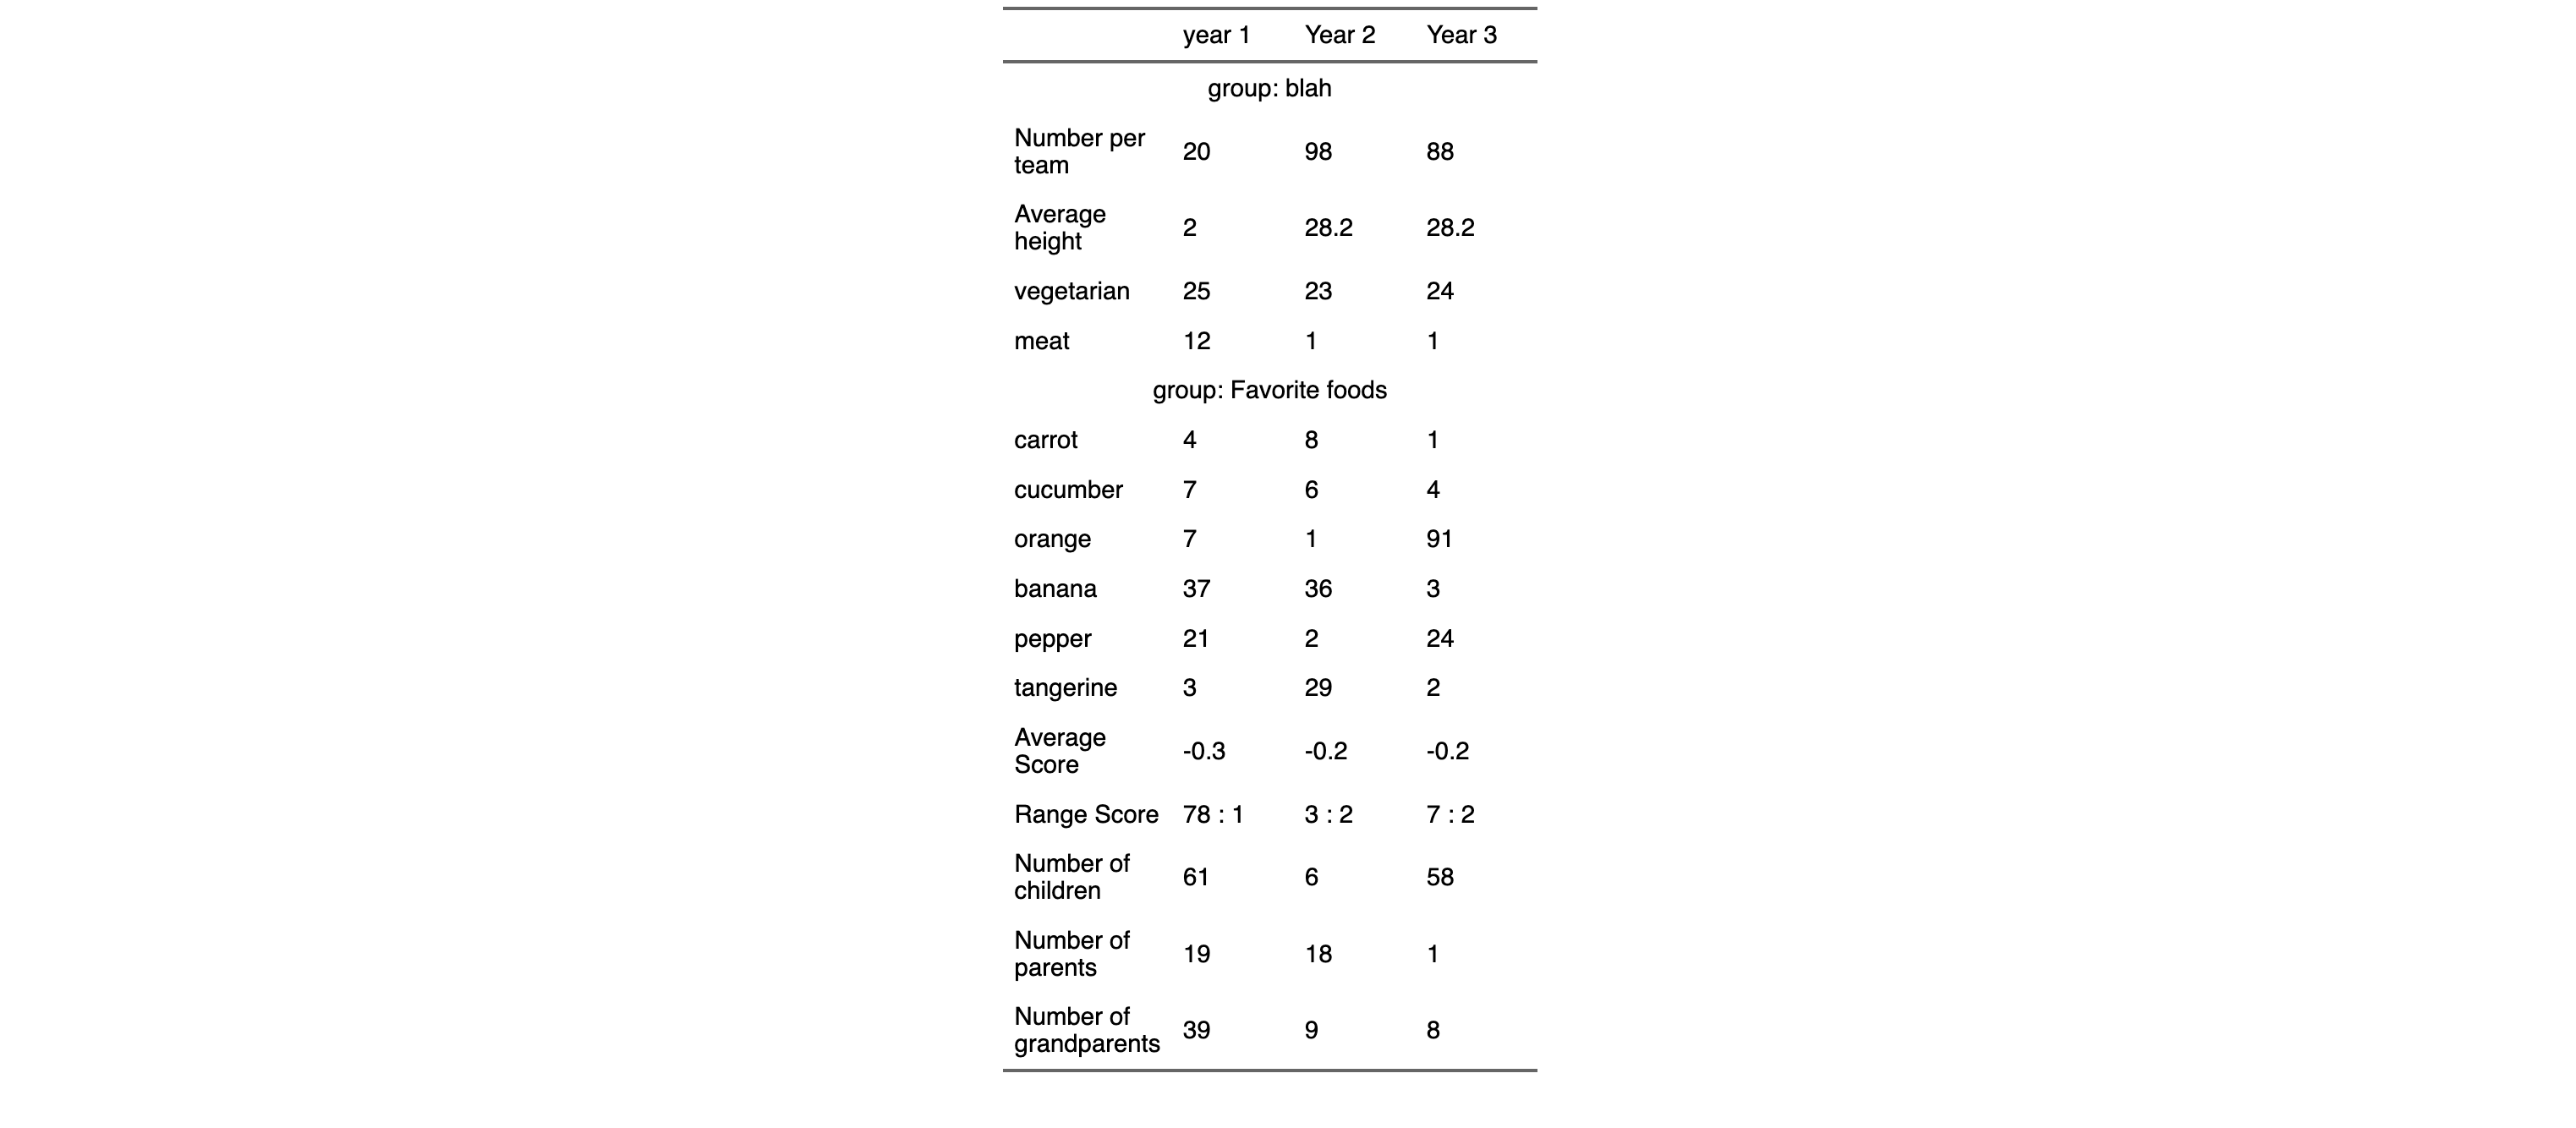
There is a solution I can think about with as_grouped_data() |> as_flextable():

library(flextable)
trialdata <- structure(list(` ` = c(
  "Number per team", "Average height", "vegetarian",
  "meat", "carrot", "cucumber", "orange",
  "banana", "pepper", "tangerine", "Average Score",
  "Range Score", "Number of children", "Number of parents",
  "Number of grandparents"
), `year 1` = c(
  "20", "2",
  "25", "12", "4", "7",
  "7", "37", "21", "3",
  "-0.3", "78 : 1", "61", "19",
  "39"
), `Year 2` = c(
  "98", "28.2", "23",
  "1", "8", "6", "1",
  "36", "2", "29", "-0.2", "3 : 2",
  "6", "18", "9"
), `Year 3` = c(
  "88",
  "28.2", "24", "1", "1", "4",
  "91", "3", "24 ", "2",
  "-0.2", "7 : 2", "58", "1",
  "8"
)), class = c("tbl_df", "tbl", "data.frame"), row.names = c(
  NA,
  -15L
))

trialdata$group <- c(rep("blah", 4), rep("Favorite foods", 11))

as_grouped_data(trialdata, groups = "group") |> 
  as_flextable() |> 
  align(i = ~ !is.na(group), align = "center")

There are other solutions like using tabulator() but for this, data should be tidy.

enter image description here

Dylane answered 27/3, 2023 at 8:23 Comment(0)
S
0

I don't think flextable accepts headers / footers that aren't, you know, at header / footer positions, but that's not to say we can't add similar looking rows programmatically into the table.

Step 1: Define new headings (I'm just going to call them sub-headers) and where they should be inserted:

sub.headers <- c("favourite foods", "other details")
insert.after <- c(4, 10)

Step 2: Define a function that inserts them as new rows into the inputted table, & outputs the result:

process.data <- function(df, lab, pos) {
  lab <- rev(lab)
  pos <- rev(pos)
  for(i in seq_along(pos)) {
    # split data frame at insert location
    df1 <- df[seq(1, pos[i]), ]
    df2 <- df[seq(pos[i] + 1, nrow(df)), ]

    # create new data frame with same column names, but with the sub-header
    # as the value for 1st column
    df.add <- df %>% slice(1)
    df.add[1, 1] <- lab[i]

    # combine the result
    df <- rbind(df1, df.add, df2)
  }
  return(df)
}

Step 3: Pass original data frame through the function and prettify the result:

header.pos <- insert.after + seq.int(length(insert.after))
border.format <- officer::fp_border(width = 2)

trialdata %>%
  process.data(lab = sub.header,
               pos = insert.after) %>%
  flextable() %>%
  merge_h_range(i = header.pos, 
                j1 = 1, j2 = ncol(trialdata)) %>%
  bold(i = header.pos) %>%                            # bold
  hline(i = header.pos, border = border.format) %>%   # add line below
  hline(i = header.pos - 1, border = border.format)   # add line above

Result:

screenshot of flextable output

Changing the values in Step 1 will enable you to adapt this for other data frames.

Shevat answered 26/3, 2023 at 12:2 Comment(0)

© 2022 - 2024 — McMap. All rights reserved.