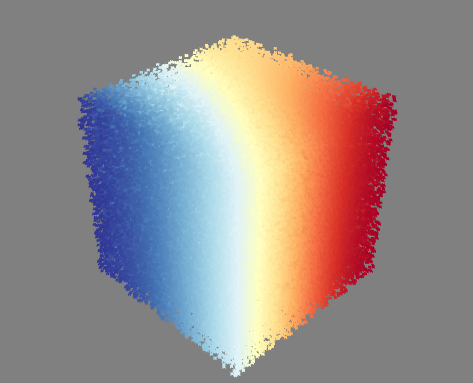
Performance-wise, the following code snippet works perfectly fine for me when plotting in mayavi.
import numpy as np
from mayavi import mlab

n = 5000
x = np.random.rand(n)
y = np.random.rand(n)
z = np.random.rand(n)
s = np.sin(x)**2 + np.cos(y)

mlab.points3d(x, y, z, s, colormap="RdYlBu", scale_factor=0.02, scale_mode='none')
But mayavi begins to choke once n >= 10000. The analogous 3d plotting routine in matplotlib, (Axes3D.scatter) similarly struggles with data sets of this size (why I started looking into mayavi in the first place).
First, is there something in mayavi (trivial or nontrivial) that I am missing that would make 10,000+ point scatter plots much easier to render?
Second, if the answer above is no, what other options (either in mayavi or a different python package) do I have to plot datasets of this magnitude?
I tagged ParaView simply to add that rendering my data in ParaView goes super smoothly, leading me to believe that I am not trying to do anything unreasonable.
Update:
Specifying the mode as a 2D glyph goes a long way towards speeding things up. E.g.
mlab.points3d(x, y, z, s, colormap="RdYlBu", scale_factor=0.02,
              scale_mode='none', mode='2dcross')
can easily support up to 100,000 points
It would still be nice if anyone could add some info about how to speed up the rendering of 3D glyphs.

