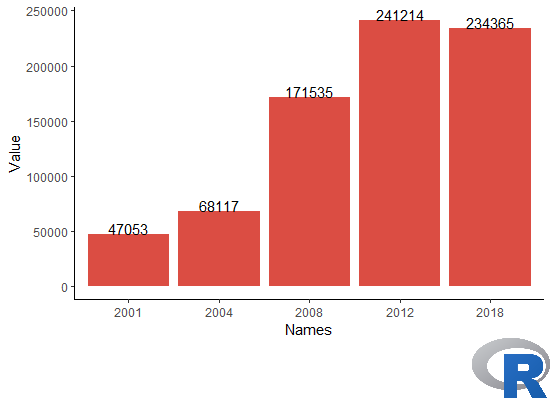
I'm currently working on a ggplot column chart and I'm trying to add a logo to the bottom right. This is the code to the chart:
df <- data.frame(Names = c("2001", "2004", "2008", "2012", "2018"),
                  Value = c(47053, 68117, 171535, 241214, 234365))

p <- ggplot(df, aes(x = Names, y = Value)) +
              geom_col(fill = "#DB4D43") + theme_classic() +
              geom_text(aes(label =  Value, y = Value + 0.05),
                        position = position_dodge(0.9),
                        vjust = 0)
I followed this tutorial I found online, but for some reason, it won't let me adjust the size of the logo and it ends up looking too small no matter what I type on the image_scale function.
img <- image_read("Logo.png")
img <- image_scale(img,"200")
img <- image_scale(img, "x200")
g <- rasterGrob(img)

size = unit(4, "cm")

heights = unit.c(unit(1, "npc") - size,size)
widths = unit.c(unit(1, "npc") - size, size)
lo = grid.layout(2, 2, widths = widths, heights = heights)

grid.show.layout(lo)

grid.newpage()
pushViewport(viewport(layout = lo))

pushViewport(viewport(layout.pos.row=1:1, layout.pos.col = 1:2))
print(p, newpage=FALSE)
popViewport()

pushViewport(viewport(layout.pos.row=2:2, layout.pos.col = 2:2))
print(grid.draw(g), newpage=FALSE)
popViewport()

g = grid.grab()

grid.newpage()
grid.draw(g)

rm(list=ls())
I found another tutorial and, after trying this, it doesn't show anything at all when I run it.
mypng <- readPNG('Logo.png')
print(mypng)

logocomp <- p + annotation_raster(mypng, ymin = 4.5,ymax= 5,xmin = 30,xmax = 35)

