SolrCloud becoming slow over time
Asked Answered
M

2

9

I have a 3 node SolrCloud setup (replication factor 3), running on Ubuntu 14.04 Solr 6.0 on SSDs. Much indexing taking place, only softCommits. After some time, indexing speed becomes really slow, but when i restart the solr service on the node that became slow, everything gets back to normal. Problem is that i need to guess which node becomes slow.

I have 5 collections, but only one collection (mostly used) is getting slow. Total data size is 144G including tlogs.

Said core/collection is 99G including tlogs, tlog is just 313M. Heap size is 16G, Total memory is 32G, data is stored on SSD. Every node is configured the same.

What appears to be strange is that i have literally hundreds or thousands of log lines per second on both slaves when this hits:

2016-09-16 10:00:30.476 INFO  (qtp1190524793-46733) [c:mycollection s:shard1 r:core_node2 x:mycollection_shard1_replica1] o.a.s.u.p.LogUpdateProcessorFactory [mycollection_shard1_replica1]  webapp=/solr path=/update params={update.distrib=FROMLEADER&update.chain=add-unknown-fields-to-the-schema&distrib.from=http://192.168.0.3:8983/solr/mycollection_shard1_replica3/&wt=javabin&version=2}{add=[ka2PZAqO_ (1545622027473256450)]} 0 0
2016-09-16 10:00:30.477 INFO  (qtp1190524793-46767) [c:mycollection s:shard1 r:core_node2 x:mycollection_shard1_replica1] o.a.s.u.p.LogUpdateProcessorFactory [mycollection_shard1_replica1]  webapp=/solr path=/update params={update.distrib=FROMLEADER&update.chain=add-unknown-fields-to-the-schema&distrib.from=http://192.168.0.3:8983/solr/mycollection_shard1_replica3/&wt=javabin&version=2}{add=[nlFpoYNt_ (1545622027474305024)]} 0 0
2016-09-16 10:00:30.477 INFO  (qtp1190524793-46766) [c:mycollection s:shard1 r:core_node2 x:mycollection_shard1_replica1] o.a.s.u.p.LogUpdateProcessorFactory [mycollection_shard1_replica1]  webapp=/solr path=/update params={update.distrib=FROMLEADER&update.chain=add-unknown-fields-to-the-schema&distrib.from=http://192.168.0.3:8983/solr/mycollection_shard1_replica3/&wt=javabin&version=2}{add=[tclMjXH6_ (1545622027474305025), 98OPJ3EJ_ (1545622027476402176)]} 0 0
2016-09-16 10:00:30.478 INFO  (qtp1190524793-46668) [c:mycollection s:shard1 r:core_node2 x:mycollection_shard1_replica1] o.a.s.u.p.LogUpdateProcessorFactory [mycollection_shard1_replica1]  webapp=/solr path=/update params={update.distrib=FROMLEADER&update.chain=add-unknown-fields-to-the-schema&distrib.from=http://192.168.0.3:8983/solr/mycollection_shard1_replica3/&wt=javabin&version=2}{add=[btceXK4M_ (1545622027475353600)]} 0 0
2016-09-16 10:00:30.479 INFO  (qtp1190524793-46799) [c:mycollection s:shard1 r:core_node2 x:mycollection_shard1_replica1] o.a.s.u.p.LogUpdateProcessorFactory [mycollection_shard1_replica1]  webapp=/solr path=/update params={update.distrib=FROMLEADER&update.chain=add-unknown-fields-to-the-schema&distrib.from=http://192.168.0.3:8983/solr/mycollection_shard1_replica3/&wt=javabin&version=2}{add=[3ndK3HzB_ (1545622027476402177), riCqrwPE_ (1545622027477450753)]} 0 1
2016-09-16 10:00:30.479 INFO  (qtp1190524793-46820) [c:mycollection s:shard1 r:core_node2 x:mycollection_shard1_replica1] o.a.s.u.p.LogUpdateProcessorFactory [mycollection_shard1_replica1]  webapp=/solr path=/update params={update.distrib=FROMLEADER&update.chain=add-unknown-fields-to-the-schema&distrib.from=http://192.168.0.3:8983/solr/mycollection_shard1_replica3/&wt=javabin&version=2}{add=[wr5k3mfk_ (1545622027477450752)]} 0 0

In this case 192.168.0.3 is the master.

My workflow is that i insert batches of 2500 docs with ~10 threads at the same time which works perfectly fine for most of the time but sometimes it becomes slow as described. Ocassionally there are updates / indexing calls from other sources, but it's less than a percent.

UPDATE

Complete config (output from Config API) is http://pastebin.com/GtUdGPLG

UPDATE 2

These are the command line args:

-DSTOP.KEY=solrrocks
-DSTOP.PORT=7983
-Dhost=192.168.0.1
-Djetty.home=/opt/solr/server
-Djetty.port=8983
-Dlog4j.configuration=file:/var/solr/log4j.properties
-Dsolr.install.dir=/opt/solr
-Dsolr.solr.home=/var/solr/data
-Duser.timezone=UTC
-DzkClientTimeout=15000
-DzkHost=192.168.0.1:2181,192.168.0.2:2181,192.168.0.3:2181
-XX:+CMSParallelRemarkEnabled
-XX:+CMSScavengeBeforeRemark
-XX:+ParallelRefProcEnabled
-XX:+PrintGCApplicationStoppedTime
-XX:+PrintGCDateStamps
-XX:+PrintGCDetails
-XX:+PrintGCTimeStamps
-XX:+PrintHeapAtGC
-XX:+PrintTenuringDistribution
-XX:+UseCMSInitiatingOccupancyOnly
-XX:+UseConcMarkSweepGC
-XX:+UseParNewGC
-XX:CMSInitiatingOccupancyFraction=50
-XX:CMSMaxAbortablePrecleanTime=6000
-XX:ConcGCThreads=4
-XX:MaxTenuringThreshold=8
-XX:NewRatio=3
-XX:OnOutOfMemoryError=/opt/solr/bin/oom_solr.sh 8983 /var/solr/logs
-XX:ParallelGCThreads=4
-XX:PretenureSizeThreshold=64m
-XX:SurvivorRatio=4
-XX:TargetSurvivorRatio=90-Xloggc:/var/solr/logs/solr_gc.log
-Xms16G
-Xmx16G
-Xss256k
-verbose:gc

UPDATE 3

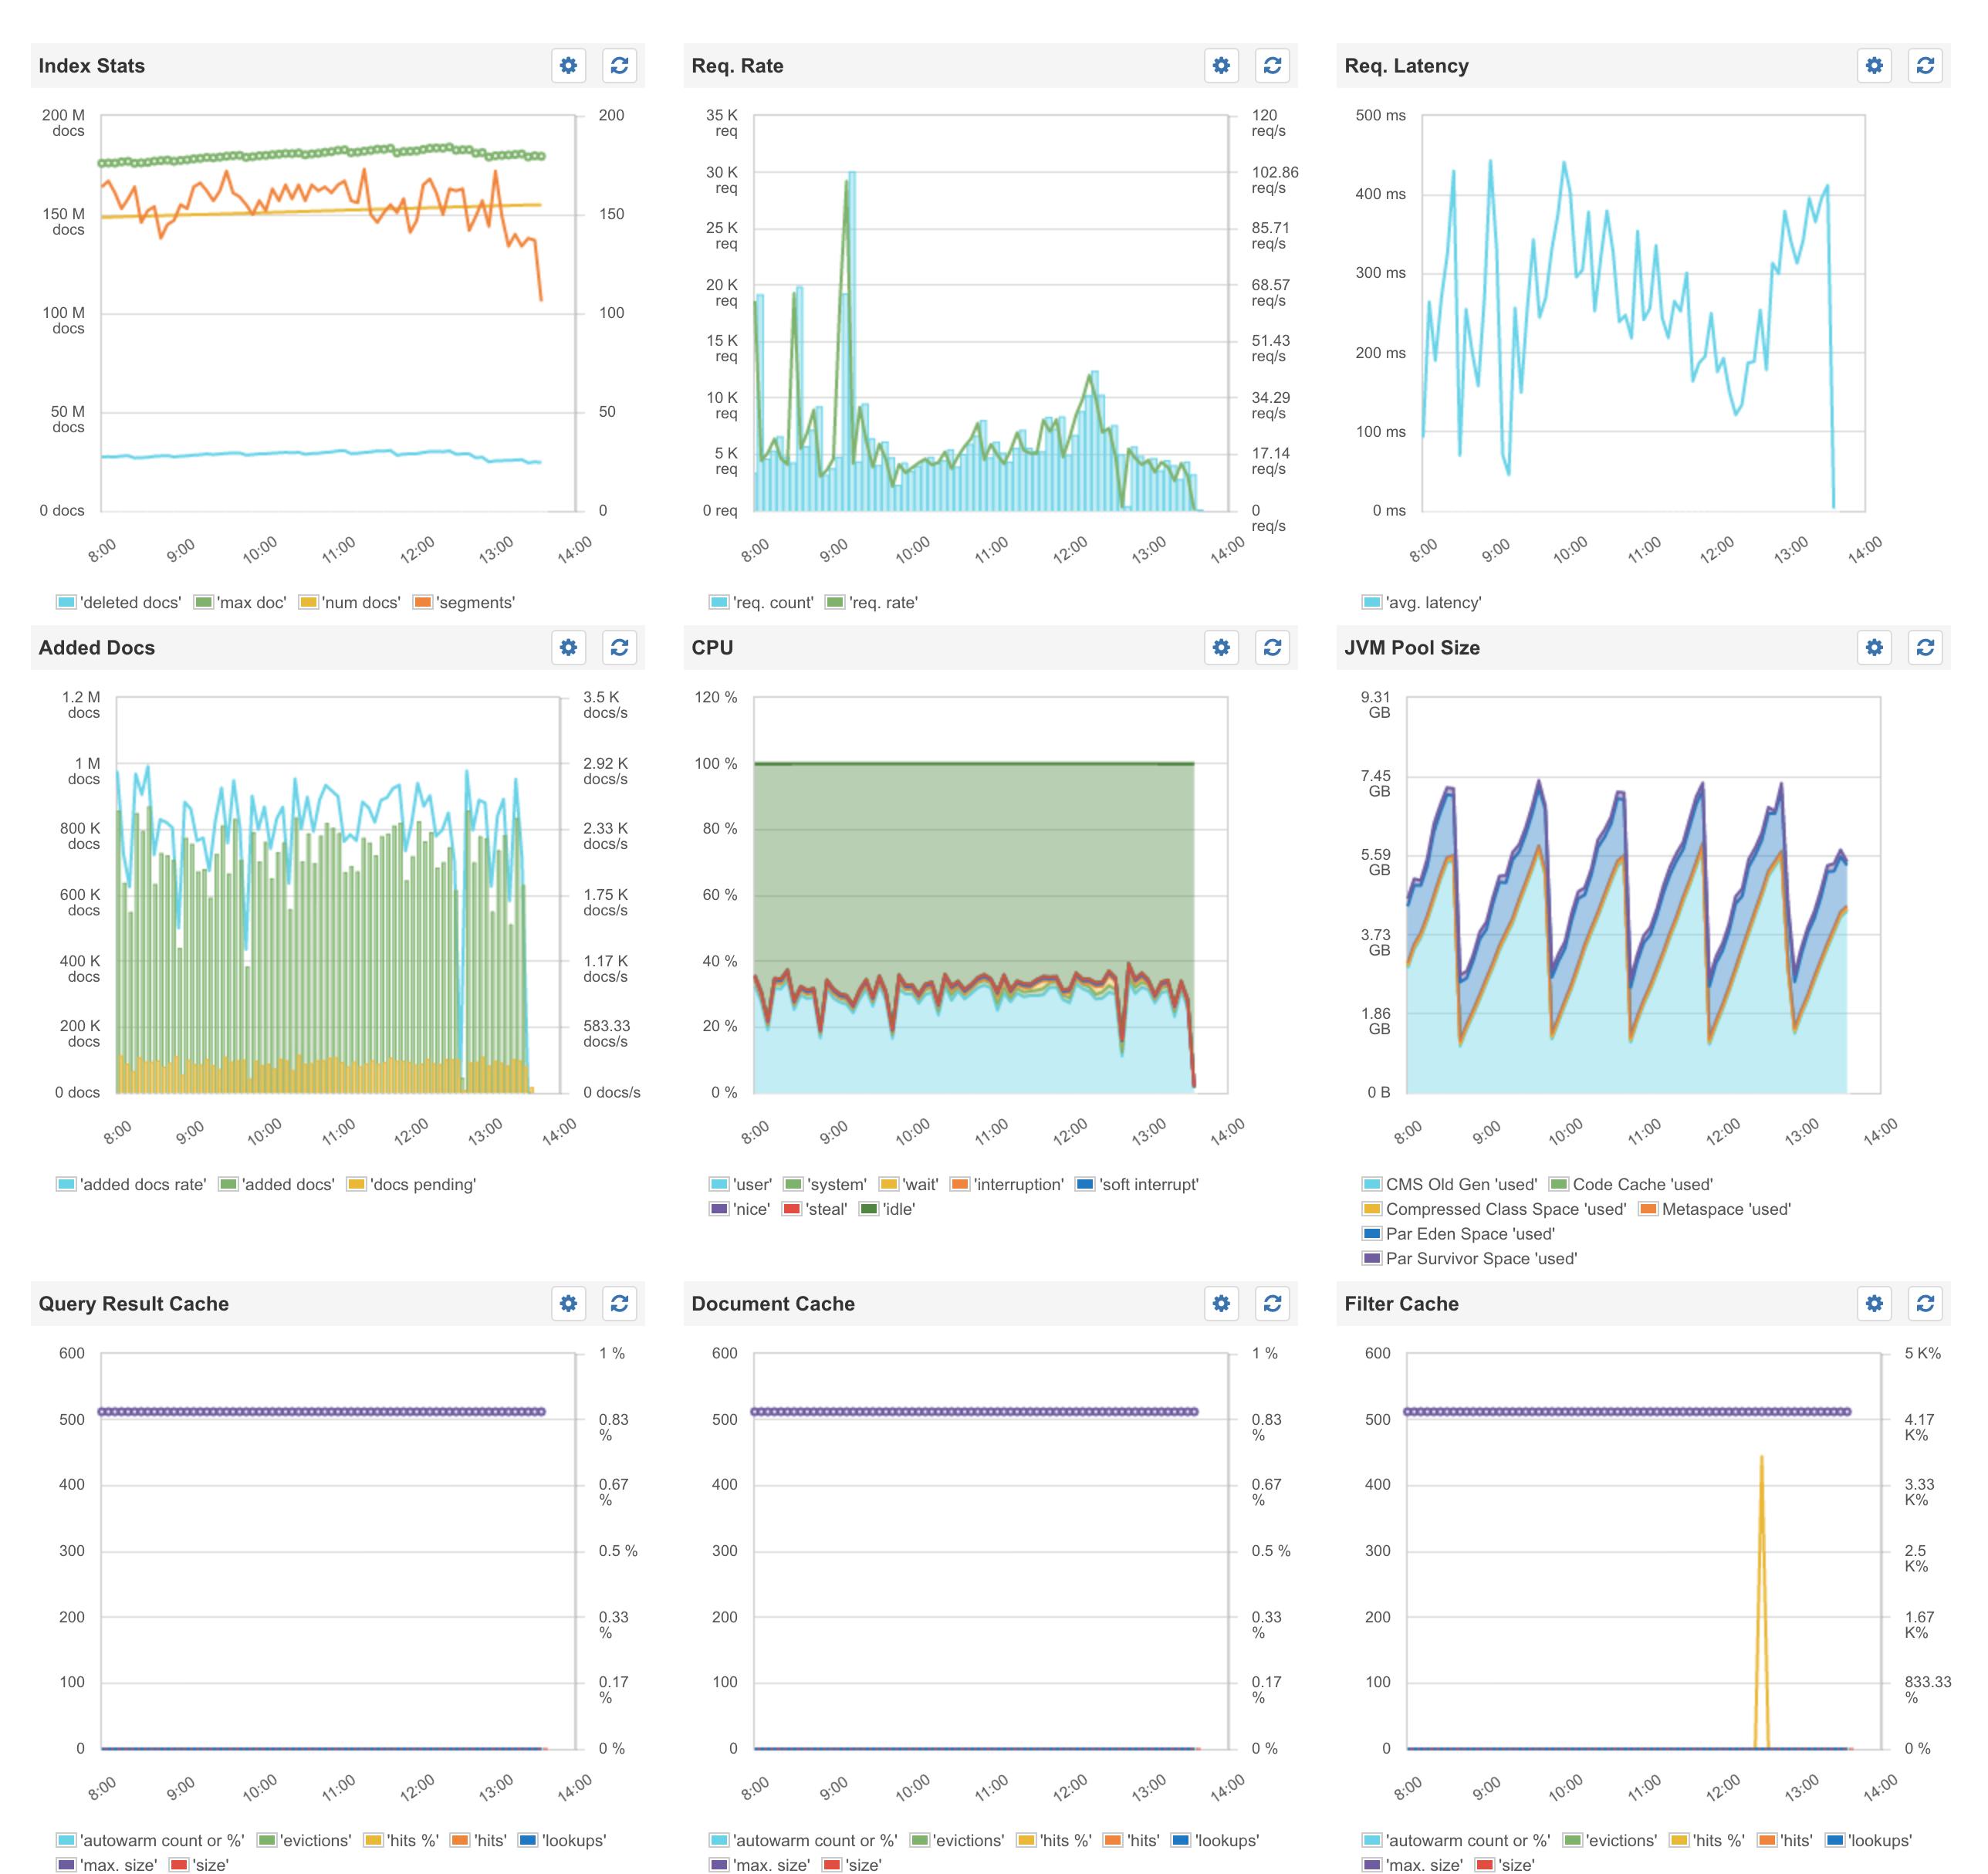
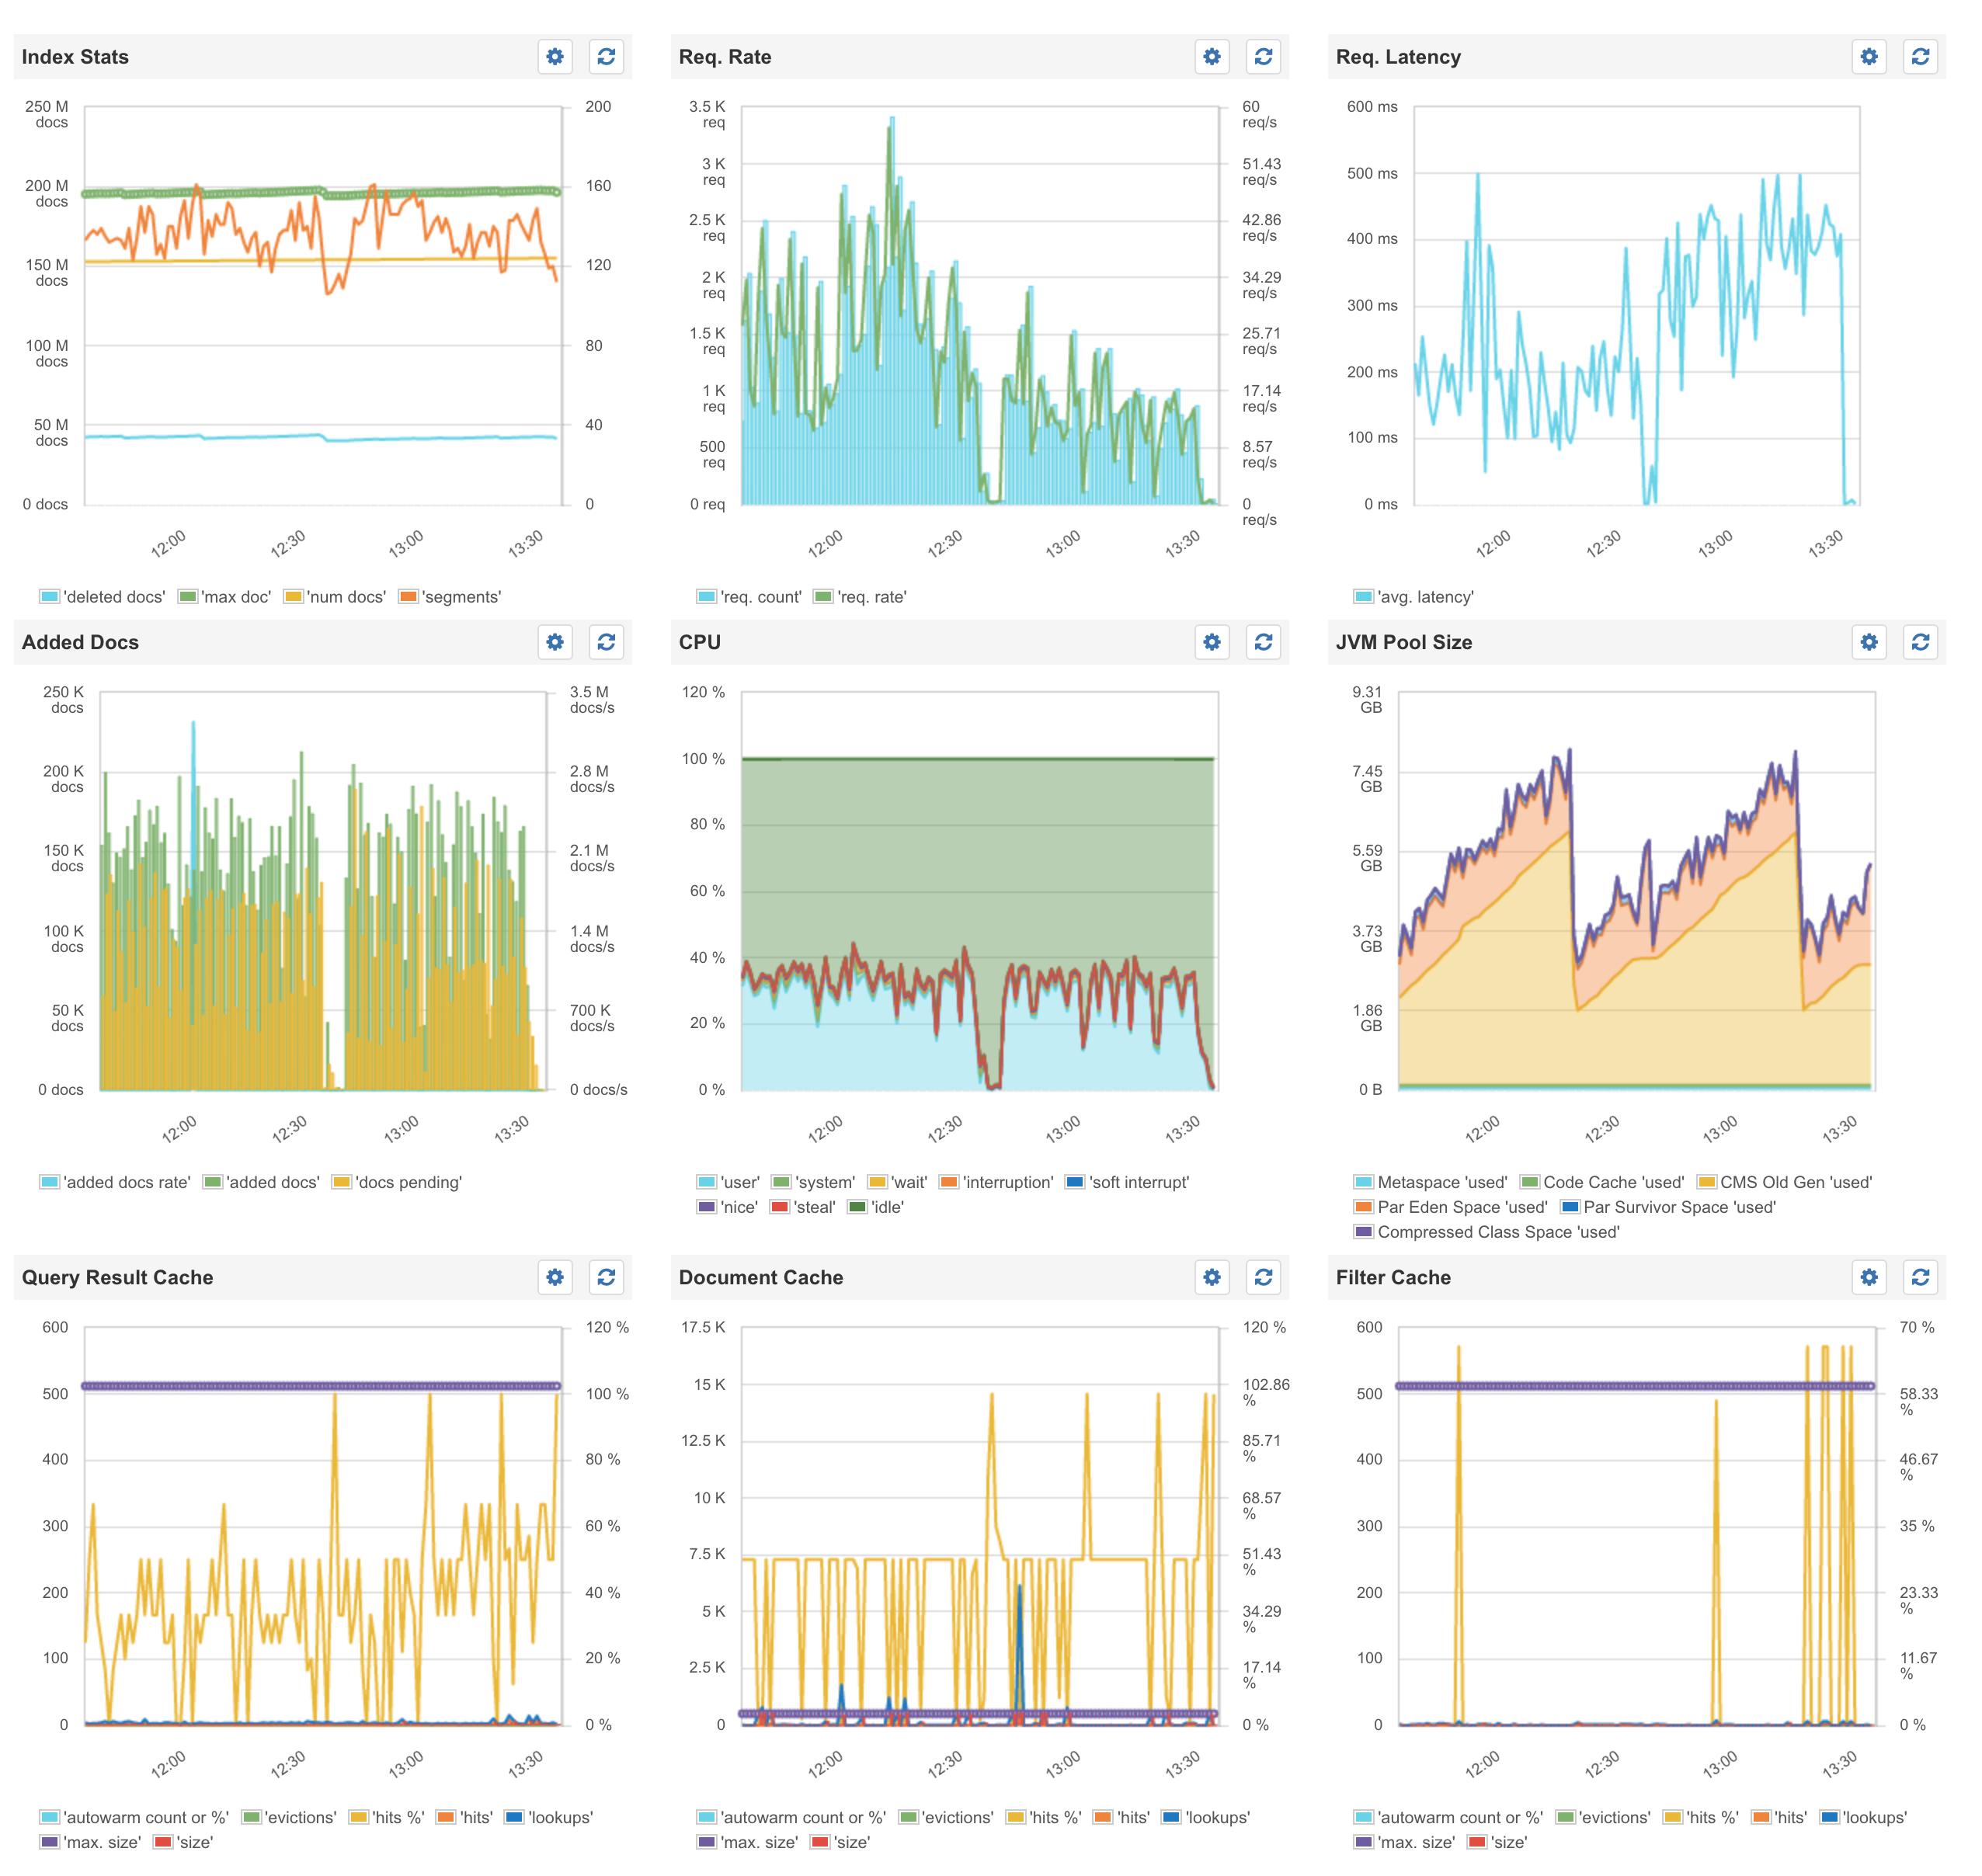
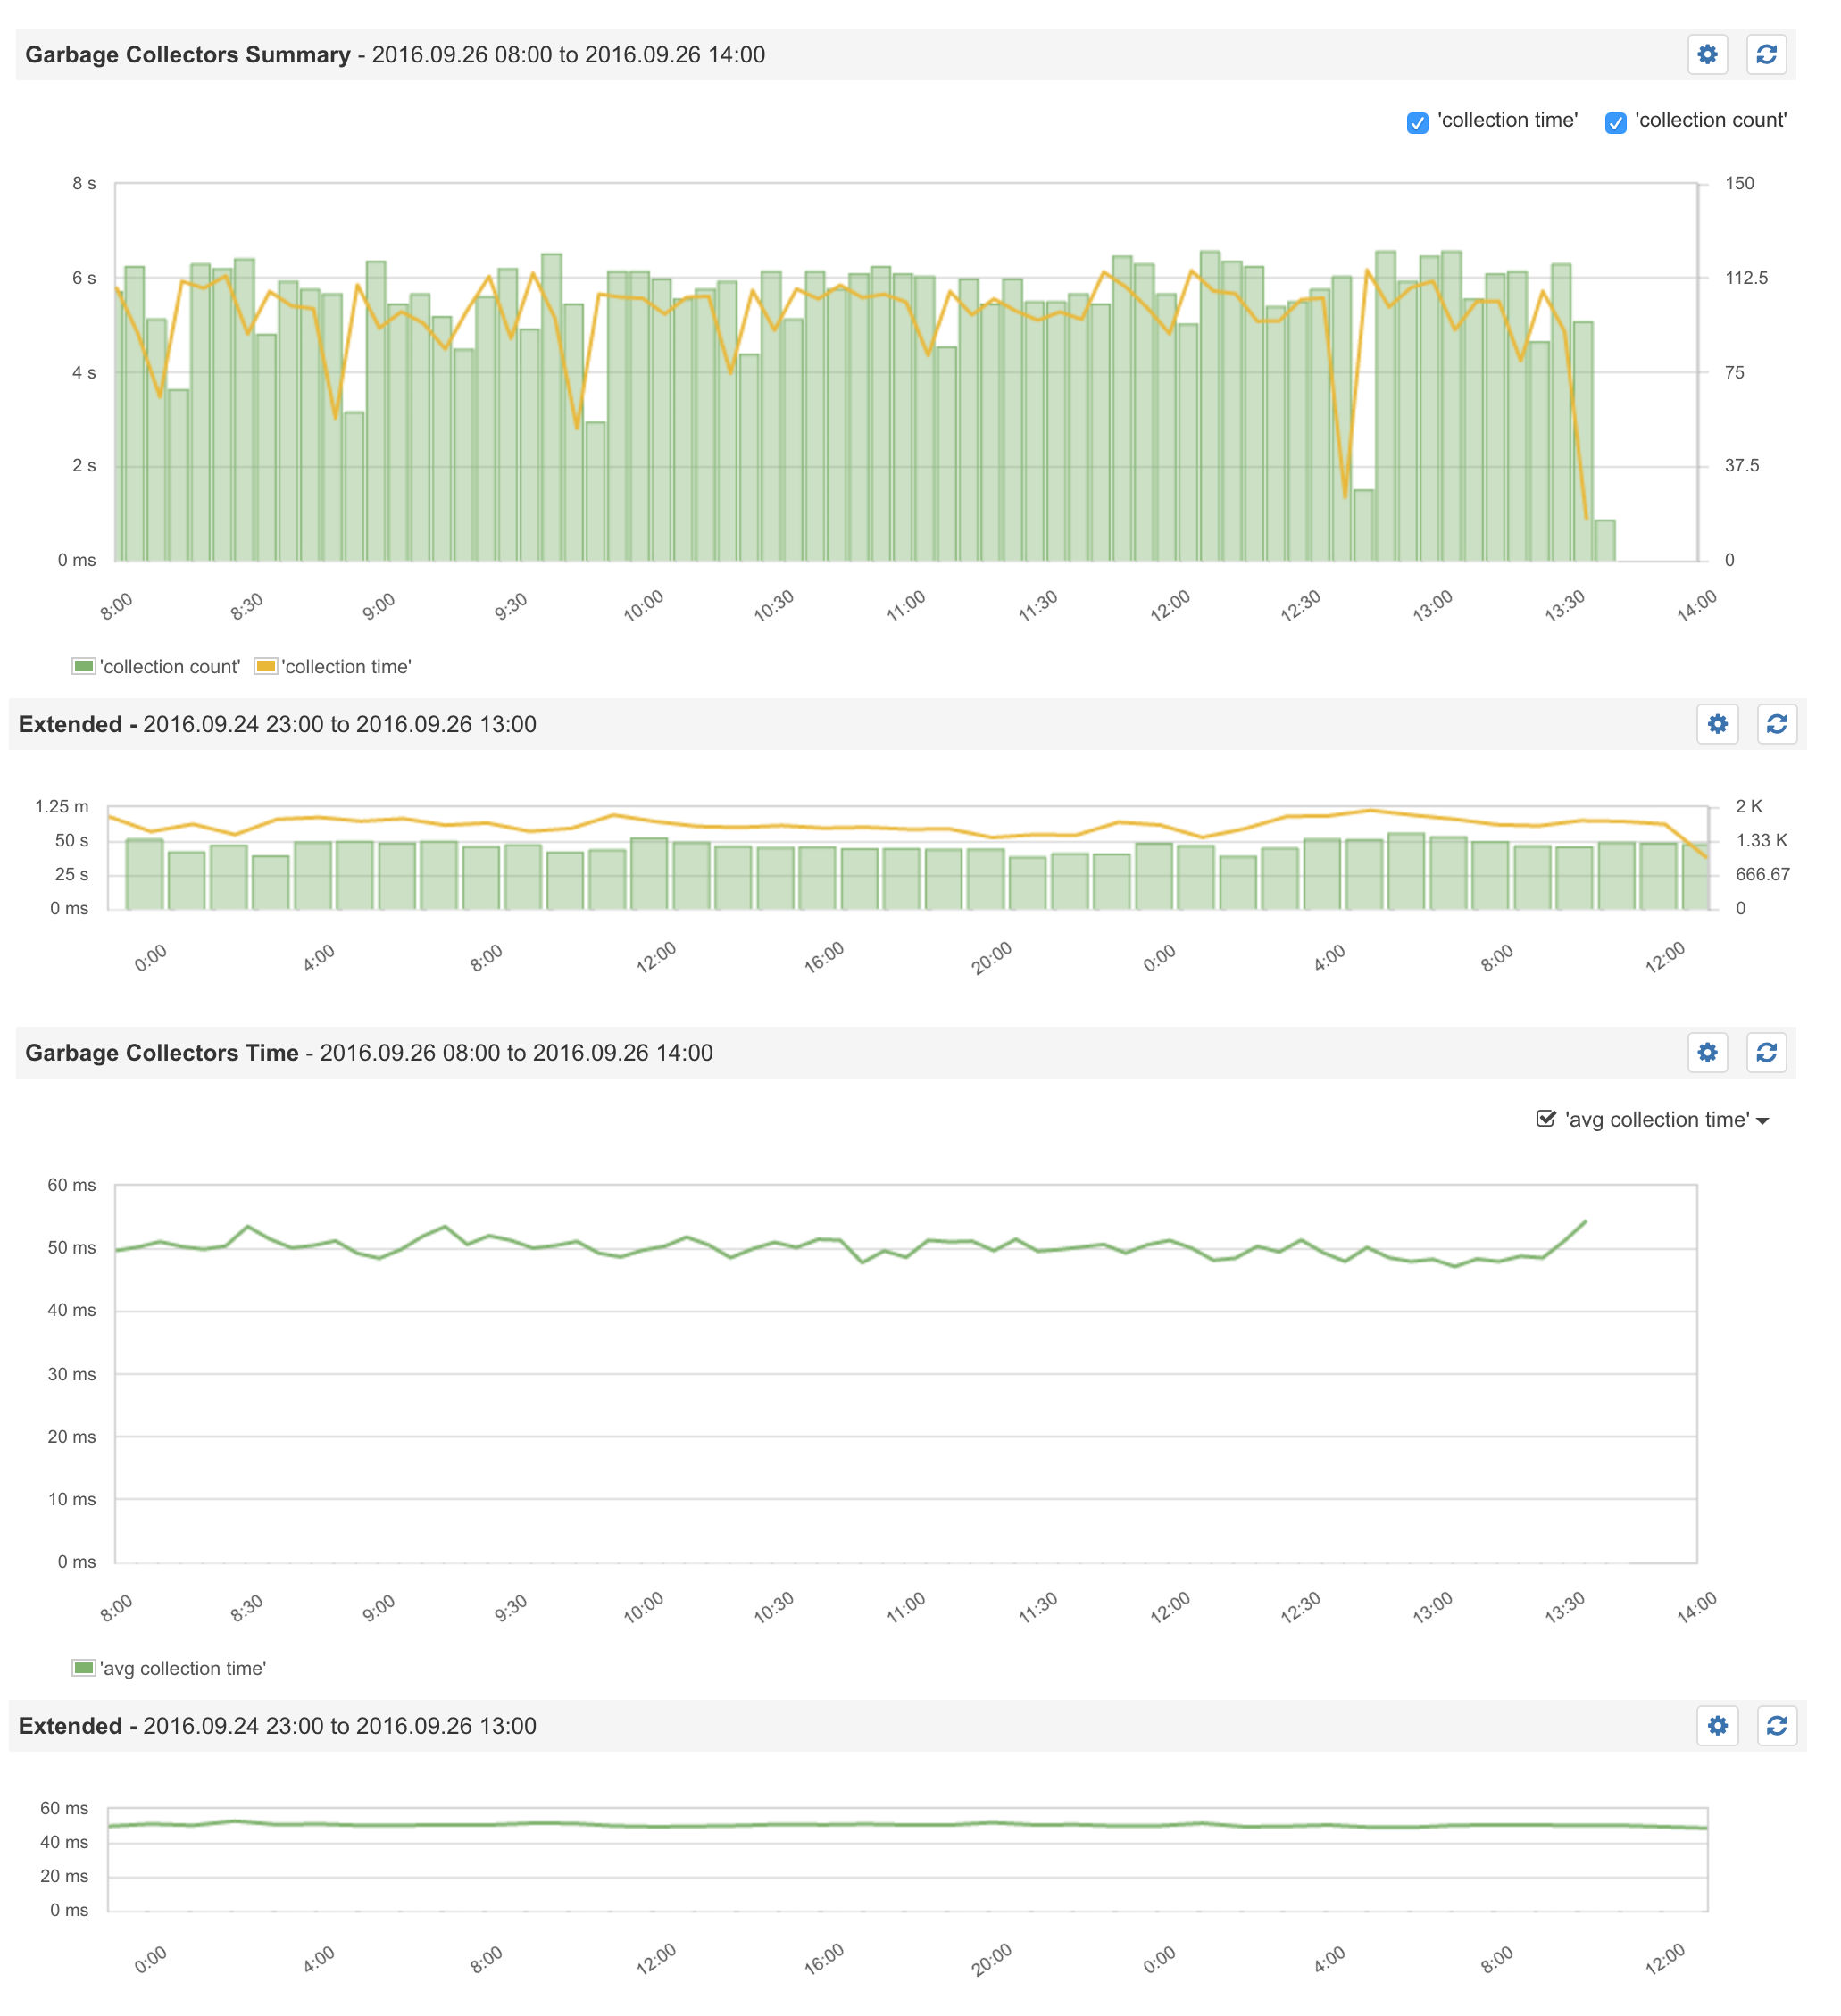
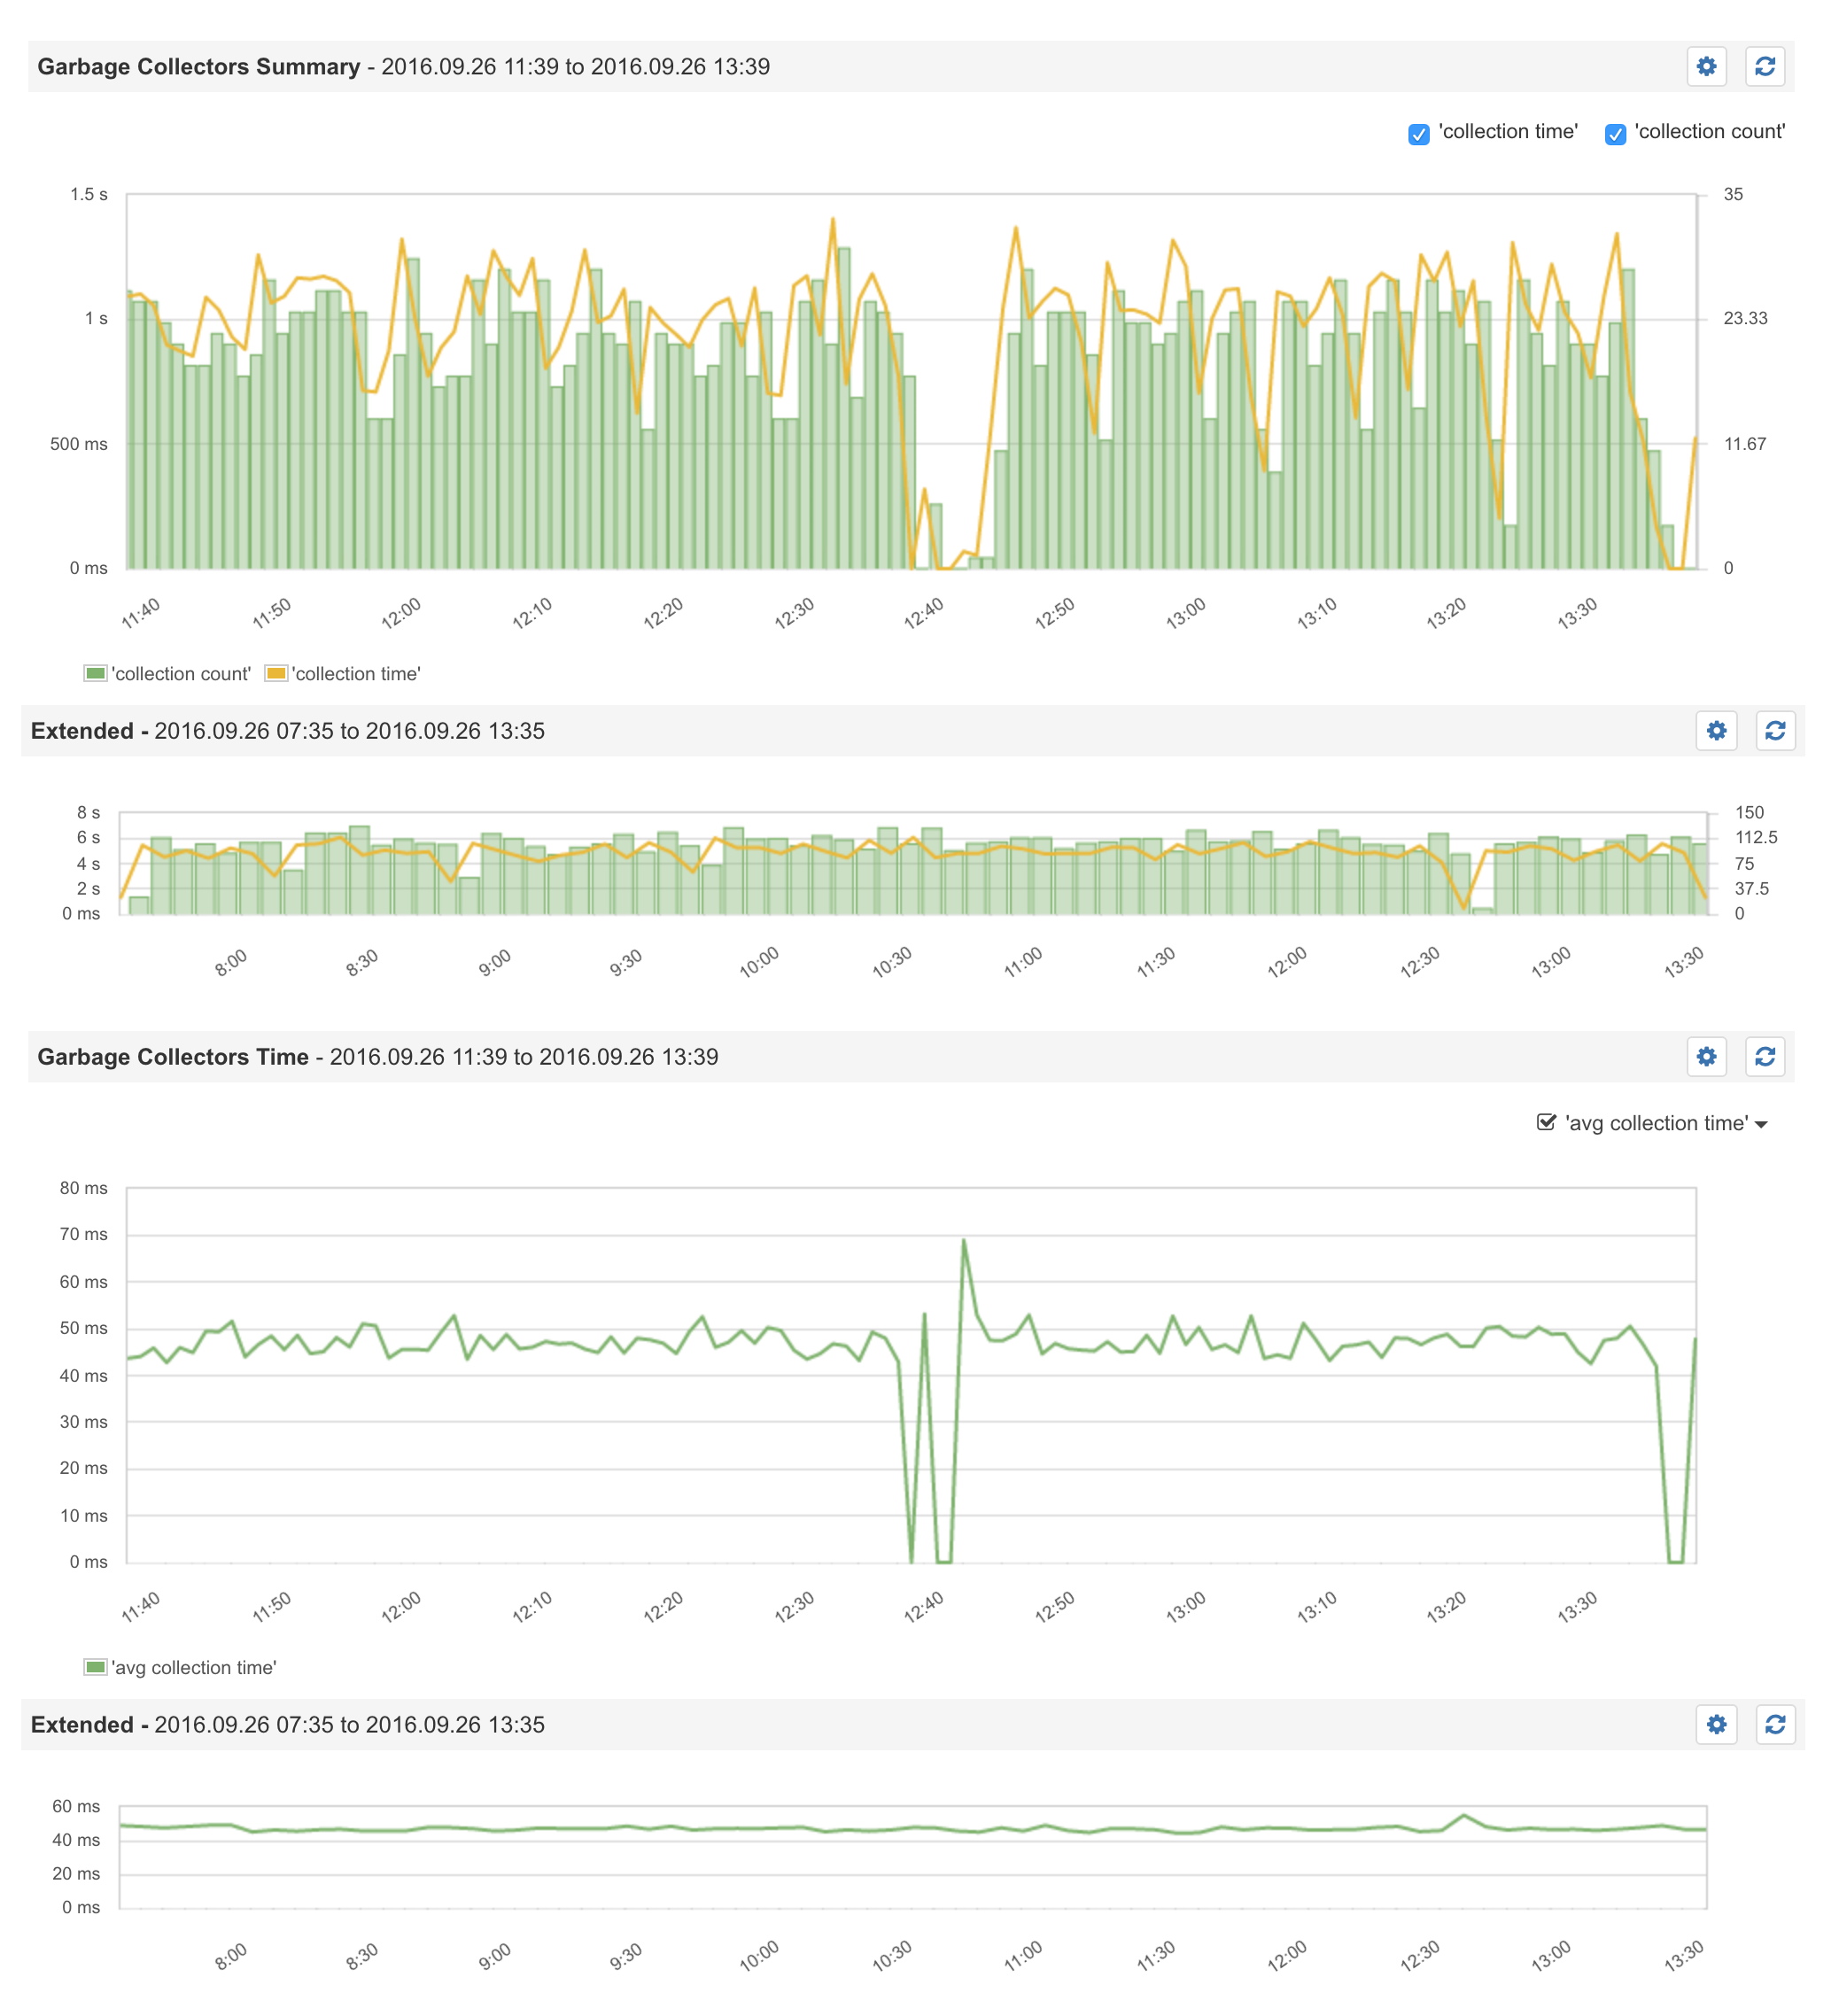
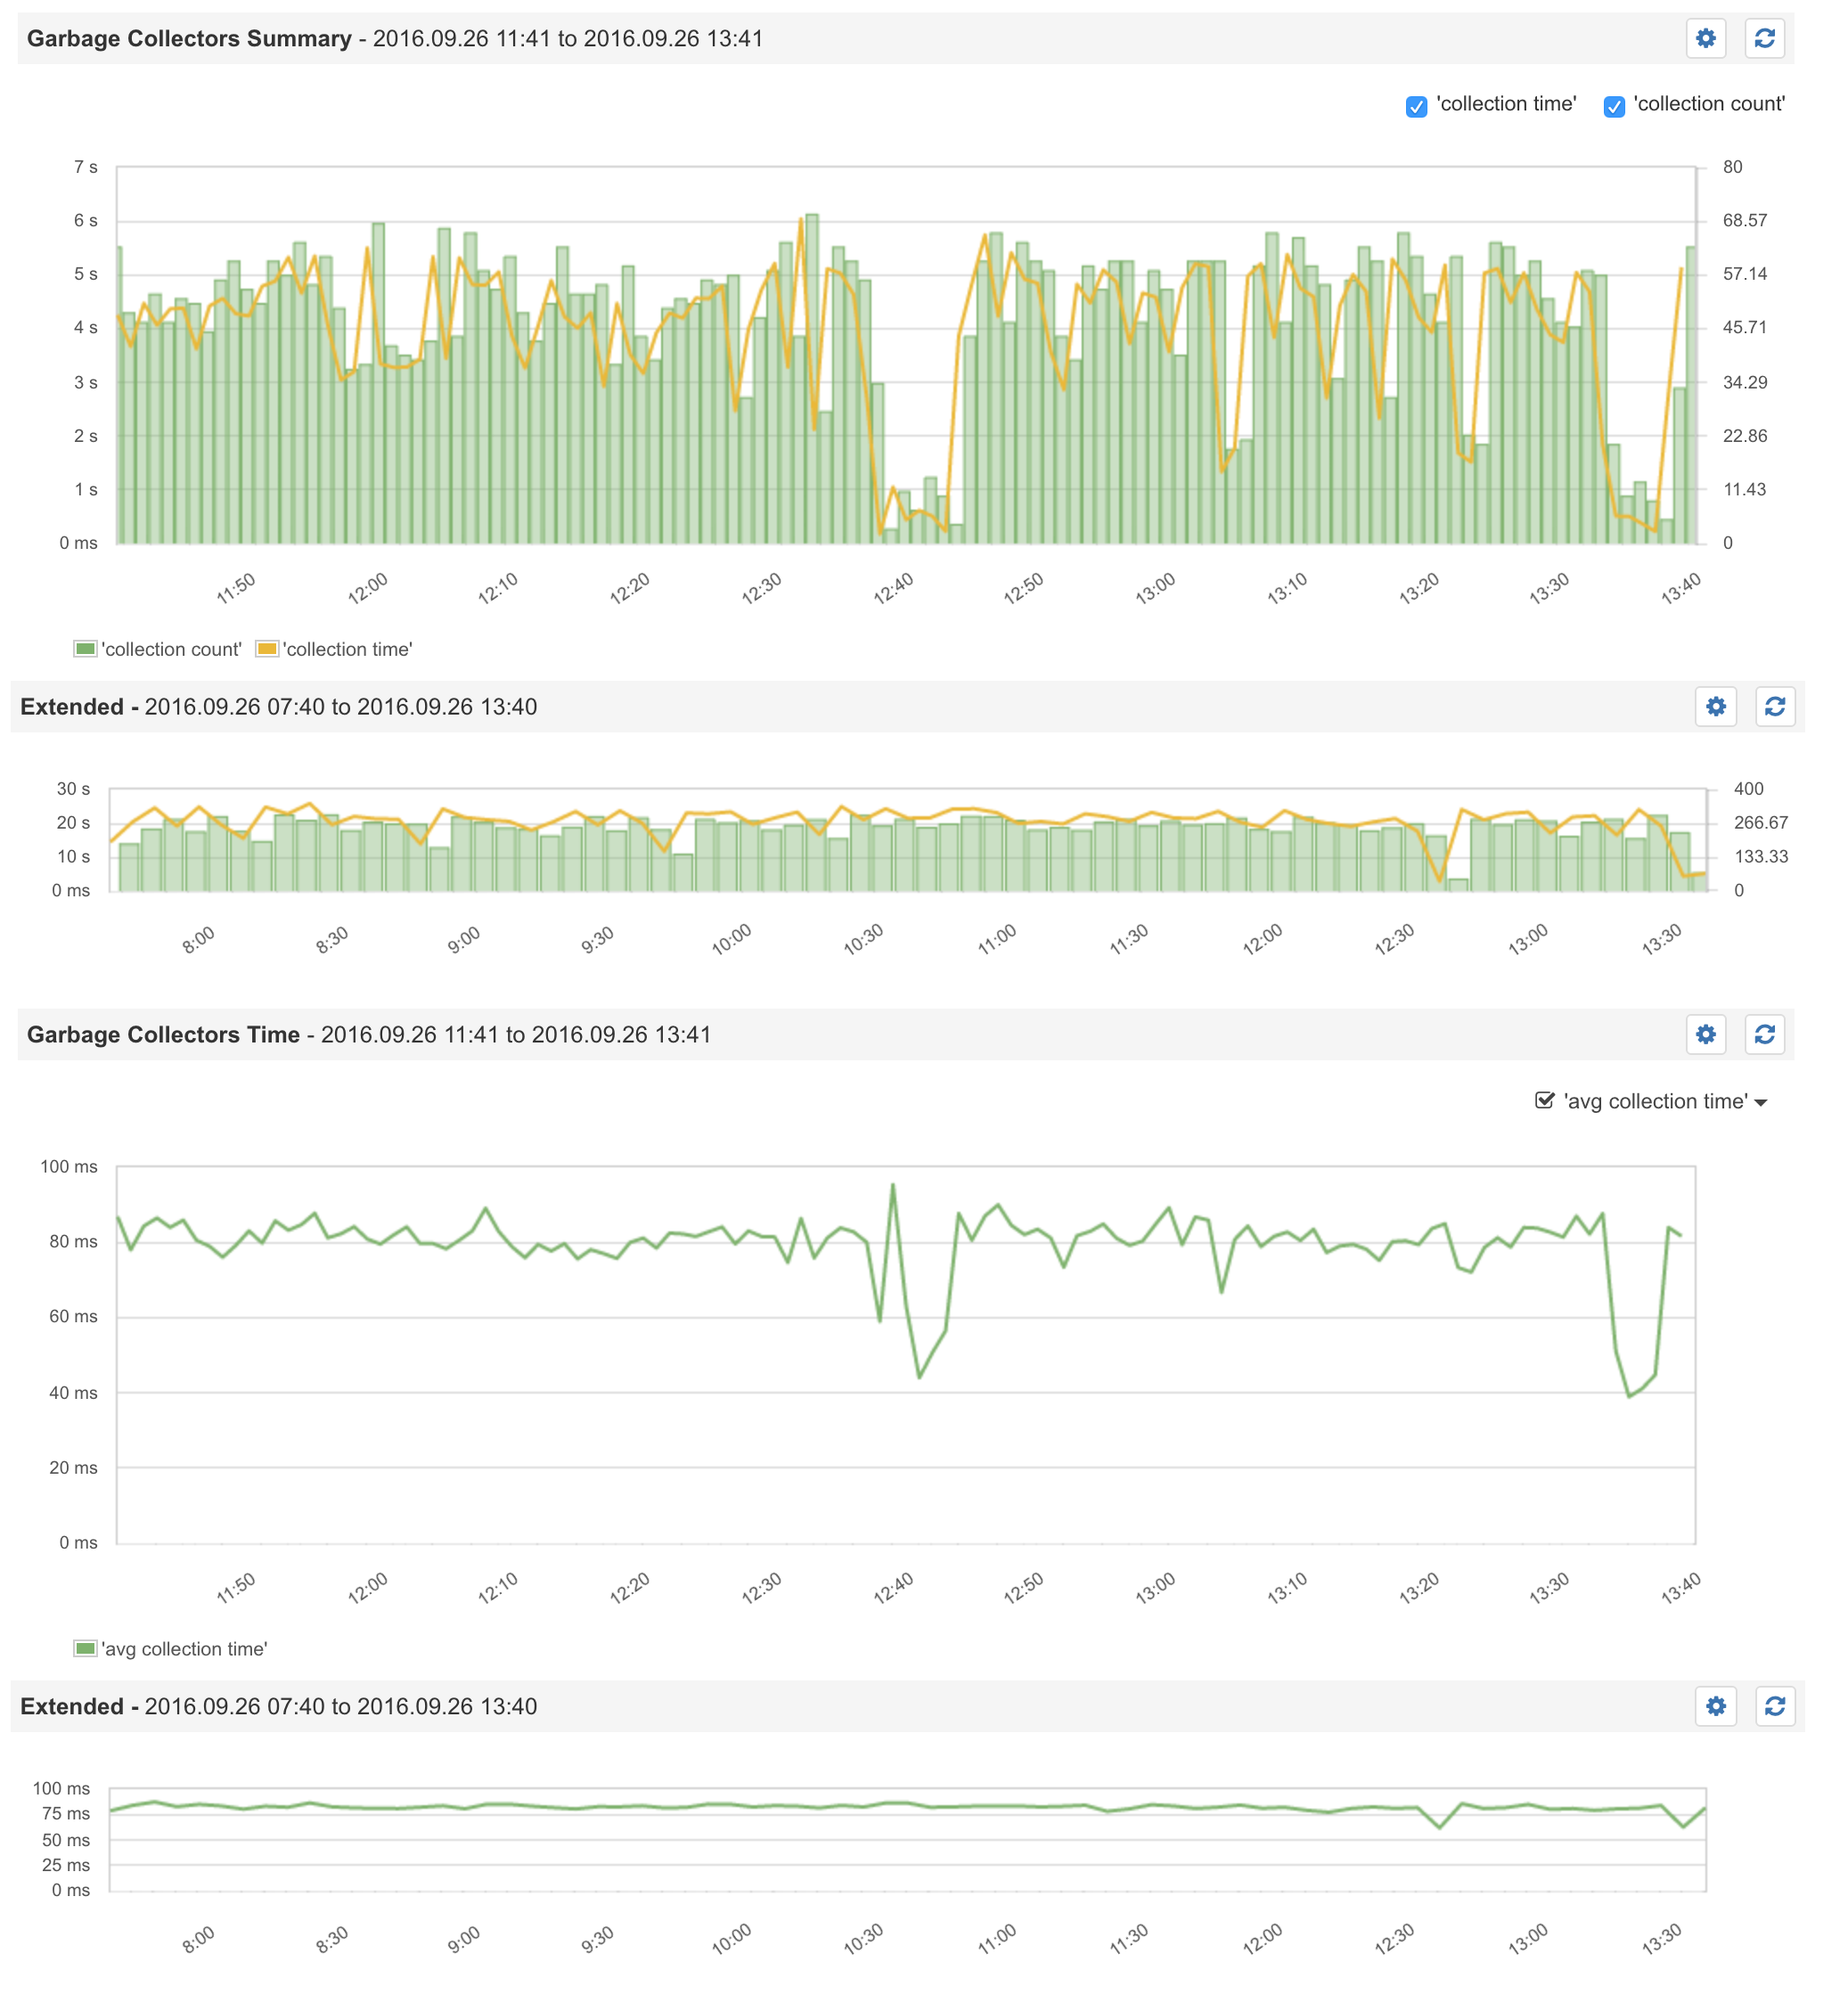
Happened again, these are some Sematext Graphs:

Sematext Dashboard for Master: Sematext Dashboard Master
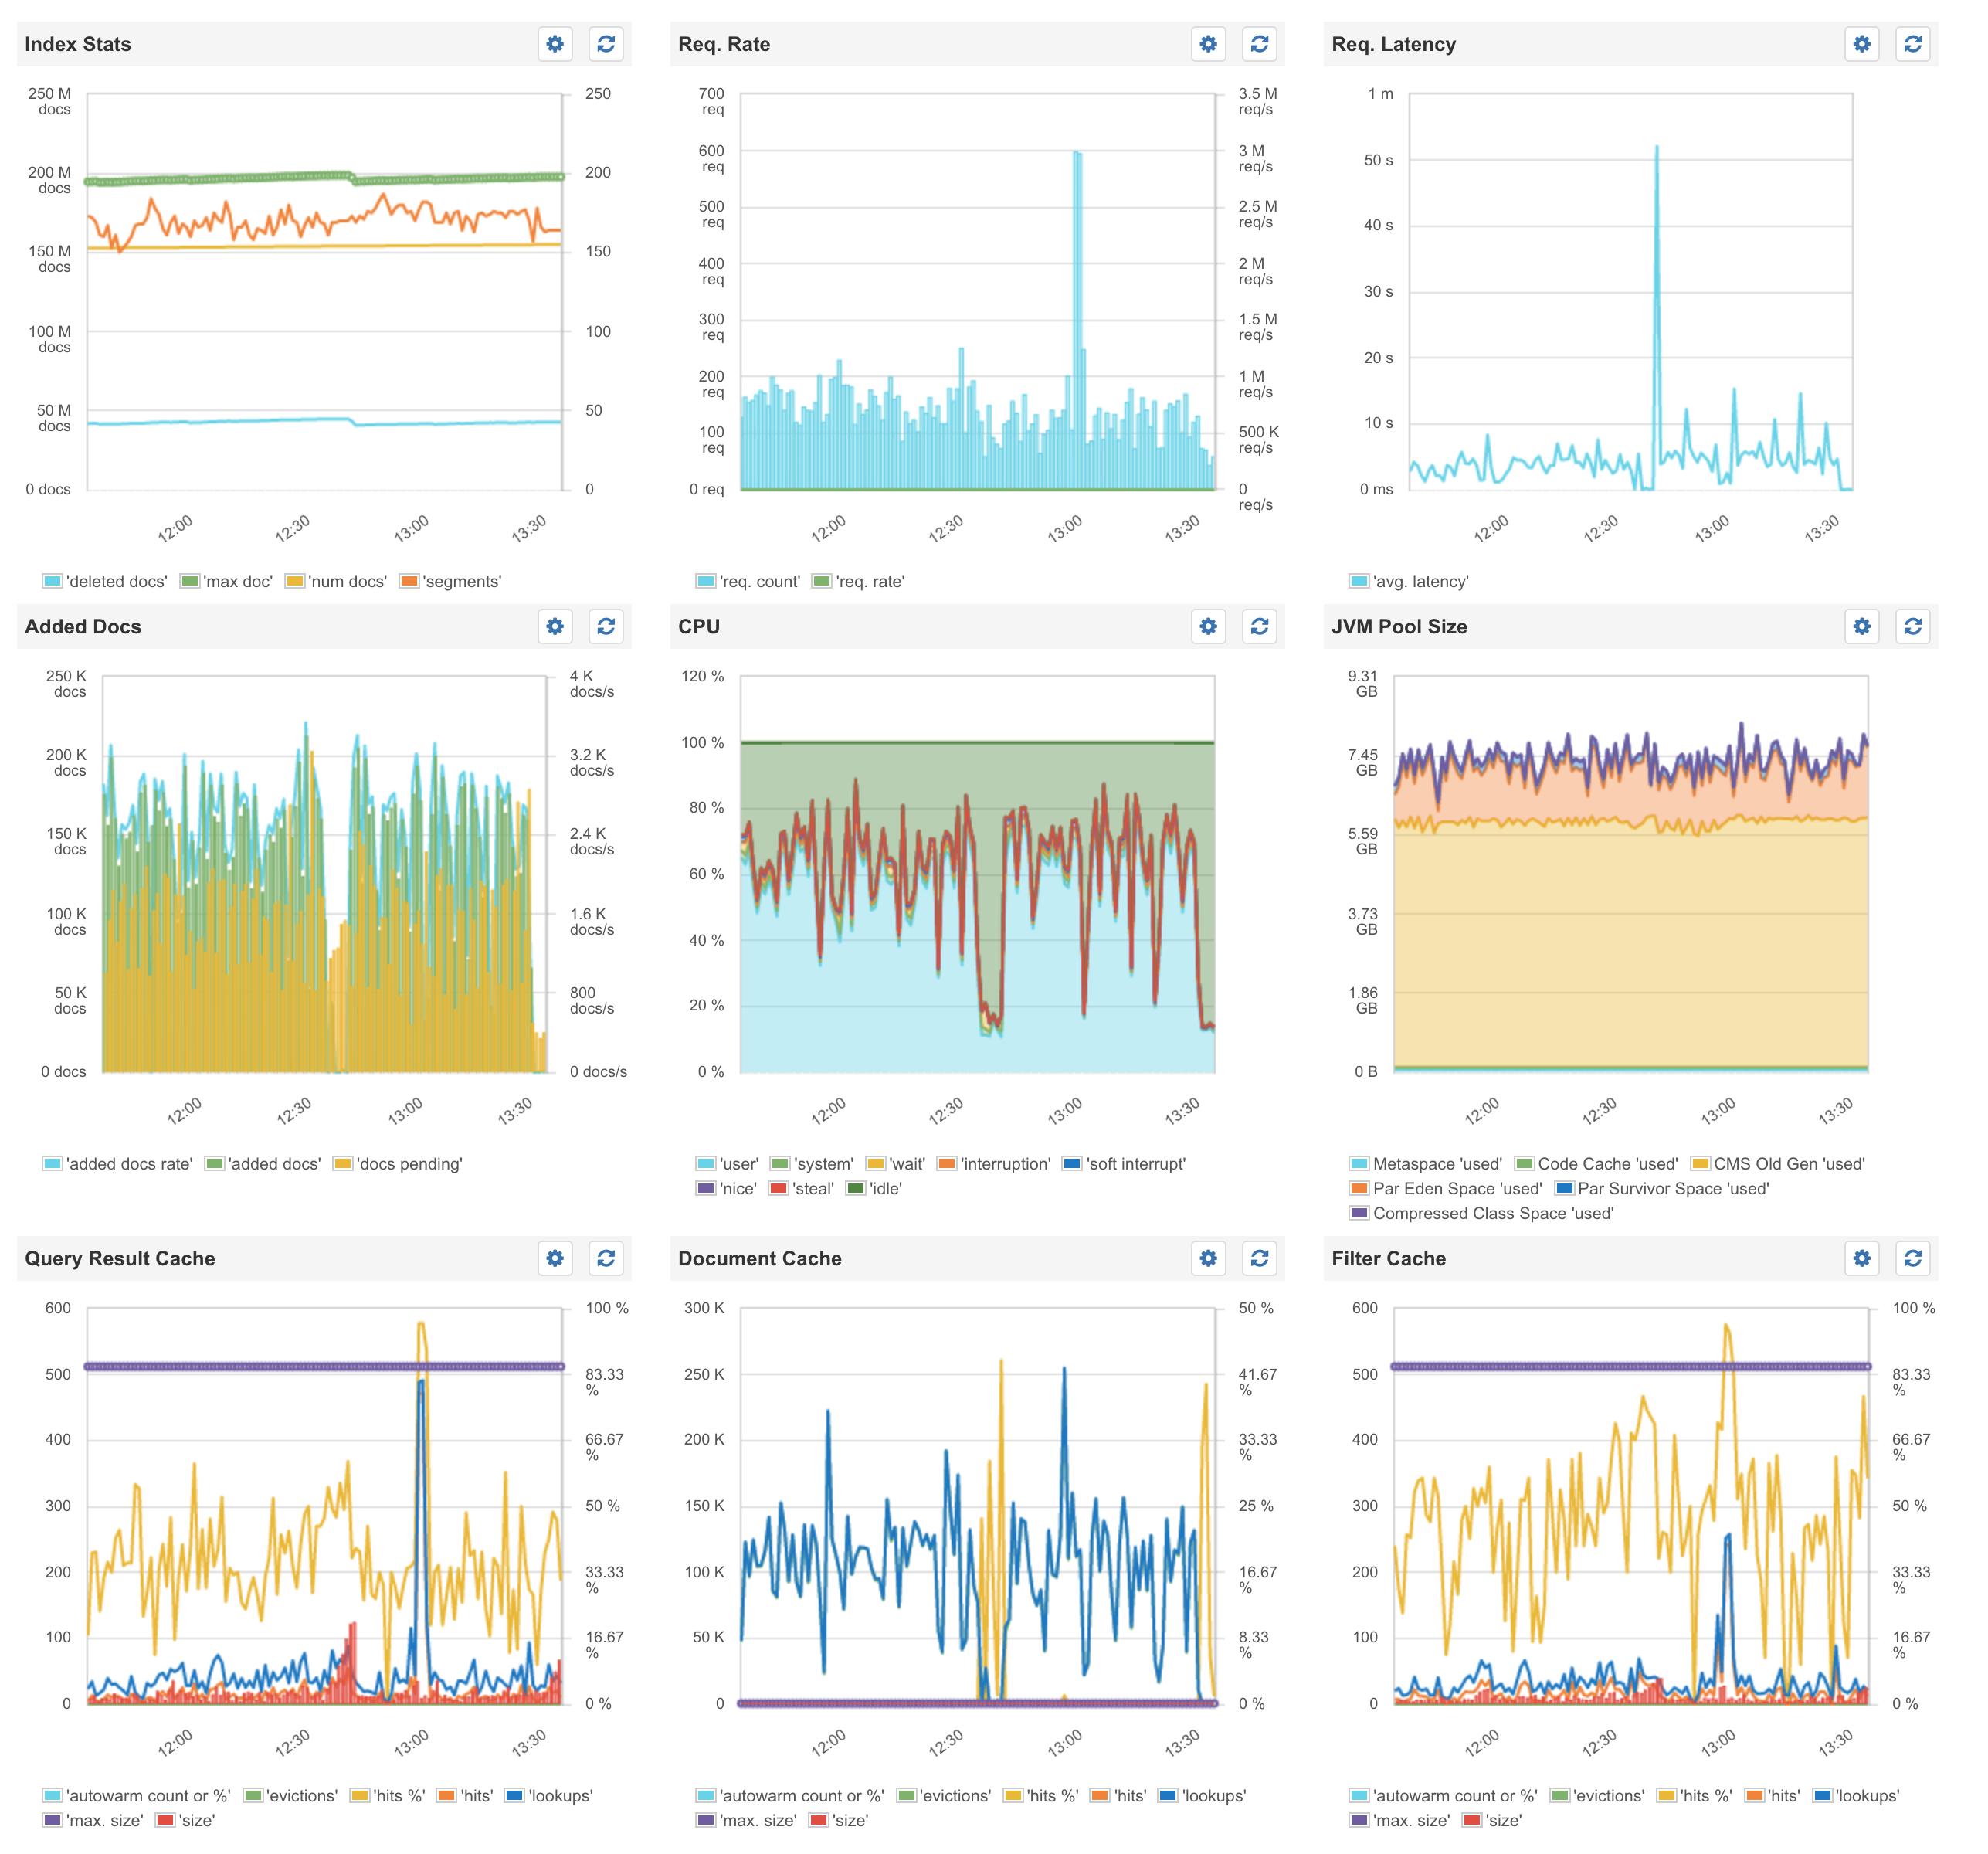
Sematext Dashboard for Secondary 1: Sematext Dashboard Secondary 1

Sematext Dashboard for Secondary 2: Sematext Dashboard Secondary 2

Sematext GC for Master: Sematext GC Master

Sematext GC for Secondary 1: Sematext GC Secondary 1

Sematext GC for Secondary 2: Sematext GC Secondary 2

UPDATE 4 (2018-01-10)

This is a quite old question, but i recently discovered that someone installed a cryptocoin miner on all of my solr machines using CVE-2017-12629 which i fixed with an upgrade to 6.6.2.

If you're not sure if your system is infiltrated check the processes for user solr using ps aux | grep solr. If you see two or more processes, especially a non-java process, you might be running a miner.

Molotov answered 16/9, 2016 at 10:50 Comment(11)
What hard commit interval do you have configured?Clout
Hi Peter, i attached the complete config, the hard commit interval is 180 sec, soft commit interval is 45 secMolotov
Are hard and soft commits only happening automatically, or are you also triggering softCommits as a part of your indexing process?Clout
It's also critical to understand the nature of the slowdown. When you monitor the slow node, are you seeing GC pauses, I/O spikes, or CPU spikes? How much heap memory is Solr using on a slow node vs an unloaded one?Clout
@Stefan, why is mergeFactor is set to -1? Its been sometime since I worked on Solr, but from what I rem the default is 10, and this parameter decides how often segments are merged.Fatality
Also do you have any performance monitoring on your servers? Do you see a spike in CPU, Memory, disk space, swap size? I have used Sematext in the past. They have a 30 day free trial. sematext.com/spm/integrations/solr-monitoring . Once installed I would keep an eye on Memory and number of segments. My guess is that too many segments try to merge together, eating up memory and in turn slowing your servers down.Fatality
@PeterDixon-Moses I/O Spikes are up to 100%, usually about less than 20%, CPU is not very loaded, top shows around 2-4. GC Pauses have not been monitored yet, will do when this happens next time.Molotov
@Fatality it's the default value that i got from bin/solr bootstrapMolotov
@Fatality swap is disabled. Memory is, as said, 32G and no OutOfMemory errors. Heap Size is set to 16G max, but at most 10G is used. GC is UseConcMarkSweepGCMolotov
Just installed sematext on one of my nodes, will install on the other two later. I'll keep you updated.Molotov
@Stefan, A couple of questions. 1. Can you paste a screenshot of this page your_server:8983/solr/#/cloud 2. Are you using Solr in schemaless mode? That would explain these lines in the log "add-unknown-fields-to-the-schema" . 3. Can you paste a copy of your schema file - for the collection which slows down? 4. Can you paste a few sample queries? Are you using group_by or facets in your queries? 5. Do you have a load balancer in front of these nodes? Or are you sending all queries to one of the nodes? 6. Are all 3 machines identical in hardware? (Cpu, memory, disk space, etc)Fatality
C
4

So you're seeing disk I/O hitting 100% during indexing with a high-write throughput application.

There are two major drivers of disk I/O with Solr indexing:

  1. Flushing in-memory index segments to disk.
  2. Merging disk segments into new larger segments.

If your indexer isn't directly calling commit as a part of the indexing process (and you should make sure it isn't), Solr will flush index segments to disk based on your current settings:

  • Every time your RAM buffer fills up ("ramBufferSizeMB":100.0)
  • Based on your 3 min hard commit policy ("maxTime":180000)

If your indexer isn't directly calling optimize as a part of the indexing process (and you should make sure it isn't), Solr will periodically merge index segments on disk based on your current settings (the default merge policy):

  • mergeFactor: 10, or roughly each time the number of on-disk index segments exceeds 10.

Based on the way you've described your indexing process:

2500 doc batches per thread x 10 parallel threads

... you could probably get away with a larger RAM buffer, to yield larger initial index segments (that are then flushed to disk less frequently).

However the fact that your indexing process

works perfectly fine for most of the time but sometimes it becomes slow

... makes me wonder if you're just seeing the effect of a large merge happening in the background, and cannibalizing system resources needed for fast indexing at that moment.


Ideas

  • You could experiment with a larger mergeFactor (e.g. 25). This will reduce the frequency of background index segment merges, but not the resource drain when they happen. (Also, be aware that more index segments often translates to worse query performance).

  • In the indexConfig, you can try overriding the default settings for the ConcurrentMergeScheduler to throttle the number of merges that can be running at one time (maxMergeCount), and/or throttle the number of threads that can be used for merges (maxThreadCount), based on the system resources you're willing to make available.

  • You could increase your ramBufferSizeMB. This will reduce the frequency of in-memory index segments being flushed to disk, also serving to slow down the merge cadence.

  • If you are not relying on Solr for durability, you'll want /var/solr/data pointing to a local SSD volume. If you're going over a network mount (this has been documented with Amazon's EBS), there is a significant write throughput penalty, up to 10x less than writing to ephemeral/local storage.

Clout answered 21/9, 2016 at 19:5 Comment(4)
This is also an interesting read about a similar situation which (though it's a bit old now) may yield additional ideas: hathitrust.org/blogs/large-scale-search/…Clout
Peter, thanks, will monitor a bit more and then make some changes if it doesn't get better. I'm not calling softCommit, commit or optimize. I only rely on the autoSoftCommit and autoCommit values. You say that mergeFactor defaults to 10, but my default config (from bin/solr bootstrap) has mergeFactor = -1 .. What does this mean?Molotov
-1 is just the value those variables get initialized to internally (code tests for -1 and if seen, uses the default values).Clout
I added some sematext charts, maybe this helps clarify what's going on.Molotov
C
2

Do you have the CPU load of each core of the master and not only the combined CPU graph ? What I noticed is when I index with Solr when Xmx is too small (could be the case if you have 144GB data and Xmx=16GB), when the indexing progresses, merging will take more and more time. During merging, typically one core=100% CPU and other cores do nothing. Your master combined CPU graph looks like that: only 20% combined load during sequences. So, check that the merge factor is a reasonable value (between 10 and 20 or something) and potentially raise Xmx. That's the two things I would play with to start with. Question: you don't have anything special with your analyzers (custom tokenizer, etc) ?

Conch answered 26/9, 2016 at 22:32 Comment(8)
If you mean, custom fieldTypes then yes. Basically for searching substrings case insensitive. I achieve this by, for example, solr.NGramFilterFactory with minGramSize=2 and maxGramSize=60Molotov
And no, i don't have the CPU load per core.Molotov
If you do "htop" on the master machine and see that during long periods, there is only one core at 100% (during the same time the Solr interface is not responsive), then you may want to raise the Xmx. Changing the merge factor can also make a difference. If neither solve totally the problem, then, it is something else, but that what I would do first.Conch
That's what i'm seeing. Is there any way to calculate a more or less specific heap size? I'm currently using 16GB of 32GB total. These machines are dedicated servers and nothing else will be running on them. Also SWAP is turned off.Molotov
Looking at the size of your data (200M docs and 144GB data) and the size of your server RAM (32GB), raising Xmx will probably help, but your data is still big. Do you have a single shard ?Conch
Yes, one shard with three replicas.Molotov
Do you recommend another shard/replica setup with 3 dedicated nodes?Molotov
when you say 99GB data, this is for a single replica or total ? If it is for a single replica, and since you have 32GB servers, I believe you need sharding. The merging in a 99GB index will be slow. Raising Xmx should help, but sharding is necessary I think. It should improve indexing and search response times.Conch

© 2022 - 2024 — McMap. All rights reserved.