How to detect multiple plateaus and ascents and descent in the time-series data using python
Asked Answered
C

2

9

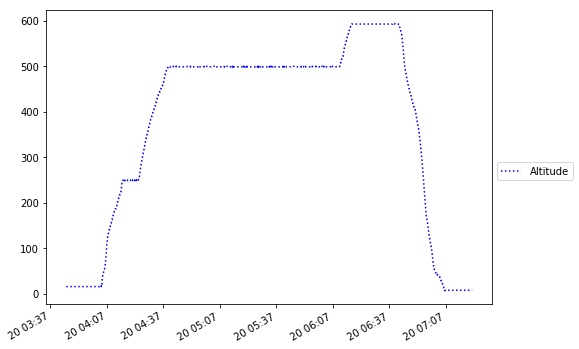
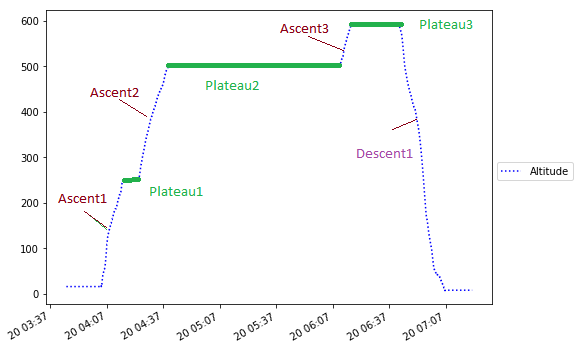
Analysing time series data of bike trails, I would like to know the time interval for each plateau ,ascent and descent.Sample csv file is uploaded here.

import pandas as pd
import numpy as np
import matplotlib.pyplot as plt
from datetime import datetime
import matplotlib.dates as mdates


df = pd.read_csv(r'C:\Data\Sample.csv', parse_dates=['dateTime'])
feature_used='Cycle_Alt'
print("Eliminating null values..")
df=df[df[feature_used].notnull()]

plt.figure(figsize=(8,6))
x=df['dateTime']        
y=df['Cycle_Alt']

plt.plot(x,y,c='b',linestyle=':',label="Altitude")
plt.xticks(rotation='vertical')
plt.gcf().autofmt_xdate()   
plt.legend(loc='best', bbox_to_anchor=(1, 0.5))

This plot provides me with a cross-profile like this. enter image description here
What could be done to classify the time-series data to detect each plateau ,ascent and descent, with the assumption that one may have more variables than presented in the sample.

enter image description here

Cly answered 30/11, 2018 at 4:29 Comment(1)
I'm not sure about the implementation as I've never used these data tools for python, but if you can find parts of the graph where the gradient is 0, that is your plateau. This can be done simply by checking the y-coordinate of one point is the same as the y-coordinate of the next point, i.e. no rise in height.Repress
S
3

If you are only interested in identify the plateaus, ascents, and descents in a series, the easy way is to use the numpy.diff function to calculate the n-th discrete difference. Then you can use the numpy.sign to convert the differences to either positive (ascents), zero (plateau), or negative (descents).

An example:

a = np.random.randint(1, 5, 10)
#array([1, 1, 1, 1, 3, 4, 2, 2, 2, 2])

diff = np.diff(a)
#array([ 0,  0,  0,  2,  1, -2,  0,  0,  0])

gradient = np.sign(diff)
#array([ 0,  0,  0,  1,  1, -1,  0,  0,  0])

Note that the final array gradient will have one fewer element than the original array, because the numpy.diff function will return (n-1) differences for an array of length n.

Smitty answered 30/11, 2018 at 5:8 Comment(0)
D
3

Not exactly what was asked but Google suggests this when searching for a plateau-finding algorithm so I'll leave this here for reference.

When just looking for plateaus, using the diff-cumsum combo to group the data can be very useful, especially when the the given values contain some amount of noise:

import numpy as np
import pandas as pd
from matplotlib import pyplot as plt

if __name__ == '__main__':
    # example data
    df = pd.DataFrame(
        {
            'time': np.arange(0, 8),
            'data': [1, 1.01, 2.0, 2.01, 2.5, 2.7, 3.1, 3.101]}
    )
    plt.plot(
        df['time'], df['data'], label=f"original data",
        marker='x', lw=0.5, ms=2.0, color="black",
    )

    # filter and group plateaus
    max_difference = 0.02
    min_number_points = 2
    # group by maximum difference
    group_ids = (abs(df['data'].diff(1)) > max_difference).cumsum()
    plateau_idx = 0
    for group_idx, group_data in df.groupby(group_ids):
        # filter non-plateaus by min number of points
        if len(group_data) < min_number_points:
            continue
        plateau_idx += 1
        plt.plot(
            group_data['time'], group_data['data'], label=f"Plateau-{plateau_idx}",
            marker='x', lw=1.5, ms=5.0,
        )
        _time = group_data['time'].mean()
        _value = group_data['data'].mean()
        plt.annotate(
            f"Plateau-{plateau_idx}", (_time, _value), ha="center",
        )
    plt.legend()
    plt.show()

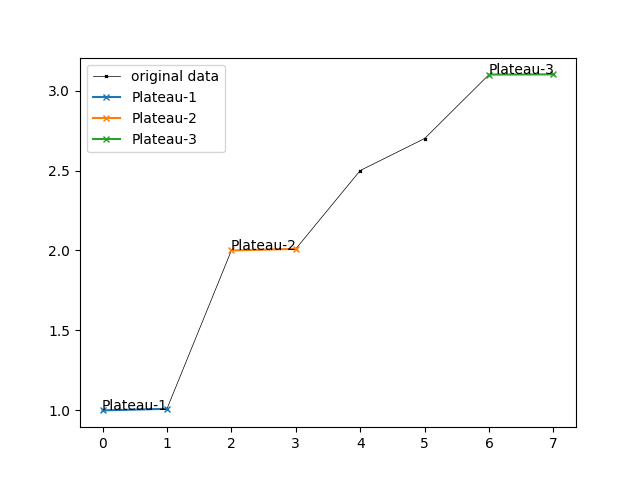
Plateau Grouping

A plateau is defined as points that are a maximum of max_difference apart, and contain at least min_number_points.

Doug answered 28/9, 2022 at 11:58 Comment(0)

© 2022 - 2024 — McMap. All rights reserved.