Importing matplotlib with reticulate in R
Asked Answered
S

4

9

I just started using the reticulate package in R, and I'm still getting a few of the kinks figured out. In particular, importing matplotlib is not going well. I've tried it two different ways, with different error messages for each.

First, using repl_python in RStudio's interactive shell:

library(reticulate)
use_python('/home/craig/anaconda3/bin/python')
py_discover_config()
repl_python()
import matplotlib.pyplot as plt

The REPL Python shell that opens up seems to have the correct version and everything, but when I try to import matplotlib.pyplot, I see the following:

ImportError: /lib/x86_64-linux-gnu/libz.so.1: version `ZLIB_1.2.9' not found (required by /home/craig/anaconda3/lib/python3.6/site-packages/matplotlib/../../.././libpng16.so.16)

Installing zlib (using sudo apt-get install lib64z1-dev lib64z1) didn't seem to change anything. FWIW, import matplotlib worked just fine, as long as I don't need pyplot.

I also tried doing the same thing in an R Markdown document:

```{r}
library(reticulate)
py_discover_config()
```

```{python}
import matplotlib.pyplot as plt
```

This time I saw:

Error in py_get_attr_impl(x, name, silent): AtributeError: module 'matplotlib' has no attribute 'pyplot' Calls: ... $.python.builtin.object -> py_get_attr -> py_get_attr_impl -> .Call Execution halted

Any ideas what might be going on here?

Thanks!

UPDATE: As I mentioned in the comments, installing the developer version of reticulate fixes some of the problems, but not all. If I try to run this Rmd:

```{r}
library(reticulate)
use_python('/home/craig/anaconda3/bin/python')
```

```{python}
import matplotlib.pyplot as plt
```

I get the following error messages:

Error in py_run_string_impl(code, local, convert) : 
  ImportError: /home/craig/anaconda3/lib/python3.6/site-packages/PyQt5/../../../libxcb-dri3.so.0: undefined symbol: xcb_send_request_with_fds

Detailed traceback: 
  File "<string>", line 1, in <module>
  File "/home/craig/anaconda3/lib/python3.6/site-packages/matplotlib/pyplot.py", line 116, in <module>
    _backend_mod, new_figure_manager, draw_if_interactive, _show = pylab_setup()
  File "/home/craig/anaconda3/lib/python3.6/site-packages/matplotlib/backends/__init__.py", line 60, in pylab_setup
[backend_name], 0)
  File "/home/craig/anaconda3/lib/python3.6/site-packages/matplotlib/backends/backend_qt5agg.py", line 16, in <module>
    from .backend_qt5 import (
  File "/home/craig/anaconda3/lib/python3.6/site-packages/matplotlib/backends/backend_qt5.py", line 18, in <module>
    import matplotlib.backends.qt_editor.figureoptions as figureoptions
  File "/home/craig/anaconda3/lib/python3.6/site-packages/matplotlib/backends/qt_editor/figureoptions.py", line 20, in <module>
Calls: <Anonymous> ... force -> py_run_string -> py_run_string_impl -> .Call
Execution halted

When I tried googling the error text, a similar error with xcb does seem to be coming up in a context that is, as far as I can tell, not so relevant.

Storz answered 10/4, 2018 at 23:13 Comment(6)
in your r markdown example you import matplotlib but not matplotlib.pyplot. is that just a copy and paste error?Marcin
It is, but I actually get the same error even if I just import matplotlib rather than matplotlib.pyplot. Importing matplotlib sans pyplot using` repl_python() rather than R Markdown gives no error.Storz
UPDATE: The R Markdown problem is still there, but I was able to solve the repl_python() error by following the instructions here: #48307349Storz
UPDATE 2: Installing the developer version of reticulate using devtools::install_github("rstudio/reticulate") helps a little (i.e. I can now import matplotlib without an error), but I'm still getting errors when I try to import matplotlib.pyplot.Storz
Getting the same error. Not getting the error if I just import matplotlib but as soon as I reference maltplotlib.pyplot it errors out. This was just in R console in RStudio as opposed to RMarkdown fwiw.Hogan
This link helped fix my problem as well #48307349Saucer
S
6

I was able to get things working by changing the R Markdown code block to read:

```{r}
library(reticulate)
use_python('/usr/bin/python3')
```

```{python}
import matplotlib.pyplot as plt
```

I still don't really understand why, but it seems that reticulate doesn't play nice with anaconda installations. Maybe it has something to do with anaconda being set up to work well with an interactive Jupyter notebook.

Storz answered 20/4, 2018 at 18:56 Comment(0)
H
1

I was able to get it to work with my conda install by sym linking the conda lib file to /lib/x86_64-linux-gnu/.

ln -s -f /opt/miniconda/lib/libz.so.1 /lib/x86_64-linux-gnu/libz.so.1

I noticed that if I ran python alone with the same import it worked fine. It appears that reticulate isn't 'seeing' the conda lib as a source for libz but does look in the /lib/x86_64-linux-gnu/ directory.

Python: 3.6
Conda: 4.5.1
OS: Ubuntu 14.04.1 LTS

Hogan answered 24/4, 2018 at 19:27 Comment(1)
Same problem -- tried this and it had very negative consequences, effectively killing my EC2 instanceAliunde
F
0

I found the same error with reticulate, which is not reading the zlib from the anaconda library but from /lib/x86_64-linux-gnu/.

Instead of symlinking, I just run the following line from terminal each time I'm using the script:

export LD_LIBRARY_PATH=/home/craig/anaconda3/lib/:$LD_LIBRARY_PATH

You can actually run it from inside the R script, giving:

system('export LD_LIBRARY_PATH=/home/craig/anaconda3/lib/:$LD_LIBRARY_PATH')
Farouche answered 14/5, 2019 at 13:30 Comment(0)
I
0

I have been working with reticulate and R Markdown and you should specify your virtual environment. For example my R Markdown starts as follows:

{r setup, include=FALSE}
knitr::opts_chunk$set(echo = TRUE, warning = FALSE, cache.lazy = FALSE)
library(reticulate)

use_condaenv('pytorch')

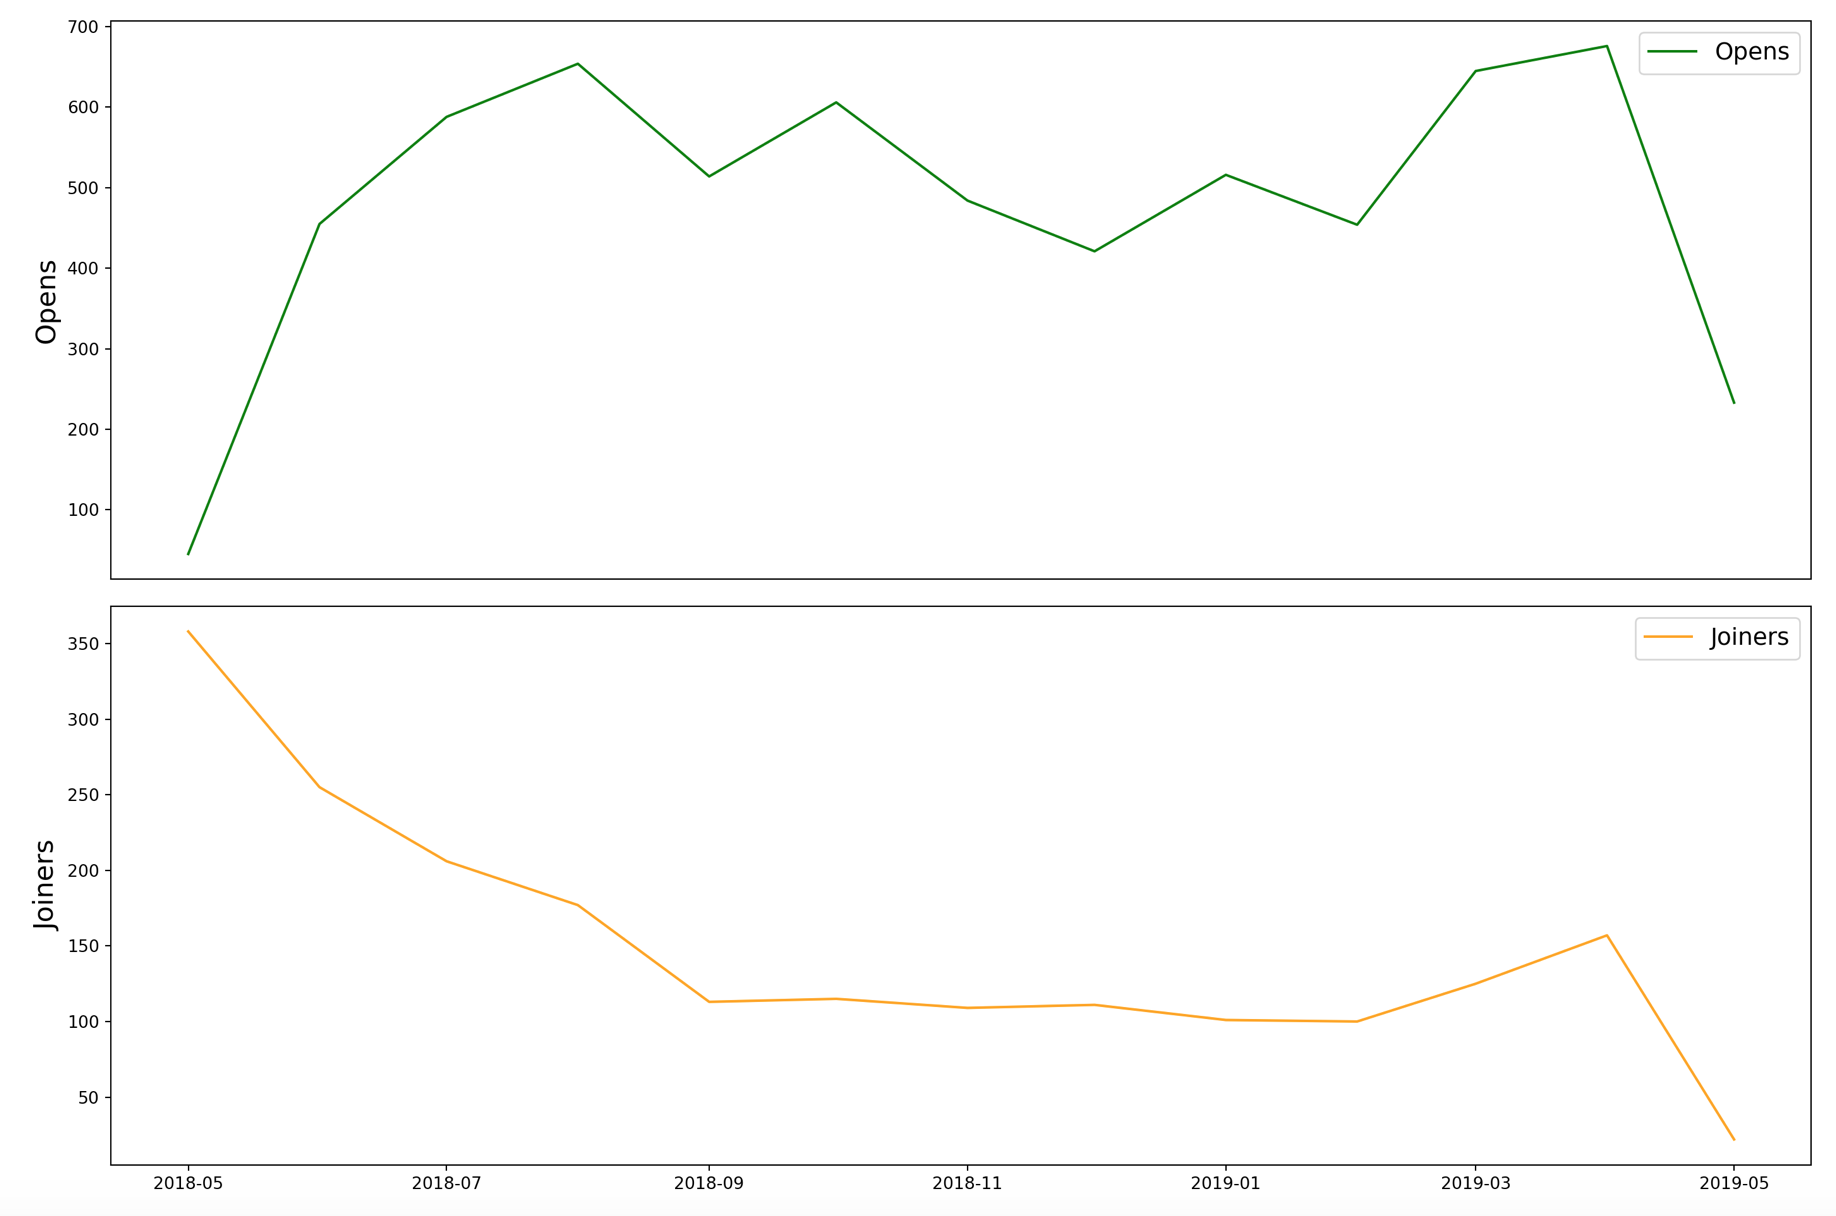
Then you can work in either language. So, for plotting with matplotlib, I have found that you need the PyQt5 module to make it all run smoothly. The following makes a nice plot inside R Markdown.

{python plot}
import PyQt5
import numpy as np
import pandas as pd
import os

import matplotlib.pyplot as plt
from matplotlib.pyplot import figure

data = pd.read_csv('Subscriptions.csv',index_col='Date', parse_dates=True)

# make the nice plot
# set the figure size
fig = plt.figure(figsize = (15,10))

# the series
ax1 = fig.add_subplot(211)
ax1.plot(data.index.values, data.Opens, color = 'green', label = 'Opens')

# plot the legend for the first plot
ax1.legend(loc = 'upper right', fontsize = 14)

plt.ylabel('Opens', fontsize=16)

# Hide the top x axis
ax1.axes.get_xaxis().set_visible(False)

#######  NOW PLOT THE OTHER SERIES ON A SINGLE PLOT

# plot 212 is the MI series

# plot series
ax2 = fig.add_subplot(212)
ax2.plot(data.index.values, data.Joiners, color = 'orange', label = 'Joiners')

# plot the legend for the second plot
ax2.legend(loc = 'upper right', fontsize = 14)

# set the fontsize for the bottom plot
plt.ylabel('Joiners', fontsize=16)

plt.tight_layout()
plt.show()

enter image description here

Introspect answered 6/9, 2019 at 18:59 Comment(0)

© 2022 - 2024 — McMap. All rights reserved.