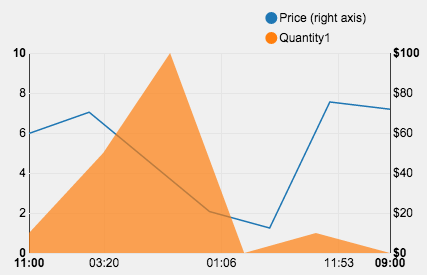
In the example above you can see that the line is rendered under the orange area graph:
Was reading this trend here, then I tried this d3.select('svg#chart .lines1Wrap').moveToFront();, but got the error moveToFront is not a function.
Chart code
var data = [{
  "key": "Price",
  "type": "line",
  "yAxis": 2,
  "values": [
    [1443621600000, 71.89],
    [1443619800000, 75.51],
    [1443618000000, 12.49],
    [1443616200000, 20.72],
    [1443612600000, 70.39],
    [1443610800000, 59.77],
  ]
}, {
  "key": "Quantity1",
  "type": "area",
  "yAxis": 1,
  "values": [
    [1136005200000, 1],
    [1138683600000, 5],
    [1141102800000, 10],
    [1143781200000, 0],
    [1146369600000, 1],
    [1149048000000, 0],
  ]
}];

data = data.map(function(series) {
  series.values = series.values.map(function(d) {
    return {
      x: d[0],
      y: d[1]
    }
  });
  return series;
});

nv.addGraph(function() {
  var chart = nv.models.multiChart()
    .margin({
      top: 20,
      right: 40,
      bottom: 50,
      left: 40
    })
    .yDomain1([0, 10])
    .yDomain2([0, 100]) // hard-coded :<
    .interpolate("linear") // don't smooth out the lines
    .color(d3.scale.category10().range());

  chart.xAxis.tickFormat(function(d) {
    return d3.time.format('%I:%M')(new Date(d));
  });
  chart.yAxis1.tickFormat(d3.format(',f'));
  chart.yAxis2.tickFormat(function(d) {
    return '$' + d3.format(',f')(d)
  });

  d3.select('svg#chart')
    .datum(data)
    .transition().duration(500).call(chart);

  d3.selection.prototype.moveToFront = function() {
      return this.each(function() {
          this.parentNode.appendChild(this);
      });
  };

  d3.select('svg#chart .lines1Wrap').moveToFront();

  chart.update();
  nv.utils.windowResize(chart.update);
  return chart;
});
UPDATE Found this answer here, tried to use the solution:
d3.selection.prototype.moveToFront = function() {
    return this.each(function() {
        this.parentNode.appendChild(this);
    });
};

d3.selection.prototype.moveToBack = function() {
    return this.each(function() {
        var firstChild = this.parentNode.firstChild;
        if (firstChild) {
            this.parentNode.insertBefore(this, firstChild);
        }
    });
};

d3.select('svg#chart .lines1Wrap').moveToFront();
d3.select('svg#chart .nv-areaWrap').moveToBack();
No more error, however the blue line graph still is not moved in front of all the others.


d3.select('svg#chart .lines2wrap').moveToFront();still same results however... – Kletter