I have a plot with a background grid. I need grid cells to be square (both major grid and minor grid cells) even though the limits of X and Y axes are different.
My current code is as follows:
import matplotlib.pyplot as plt
import matplotlib.ticker as plticker
import numpy as np

data = [0.014,  0.84,  0.95, -0.42, -0.79,  0.84, 0.98,  1.10,   0.56, -0.49]


fig, ax = plt.subplots(figsize=(20, 5))
ax.minorticks_on()

# Set major and minor grid lines on X
ax.set_xticks(np.arange(0, 10, 0.2))
ax.xaxis.set_minor_locator(plticker.MultipleLocator(base=0.2 / 5.))
for xmaj in ax.xaxis.get_majorticklocs():
        ax.axvline(x=xmaj, ls='-', color='red', linewidth=0.8)
for xmin in ax.xaxis.get_minorticklocs():
    ax.axvline(x=xmin, ls=':', color='red', linewidth=0.6)

# Set major and minor grid lines on Y
ylim = int(np.ceil(max(abs(min(data)), max(data))))
yticks = np.arange(-ylim, ylim + 0.5, 0.5)
ax.set_yticks(yticks)
ax.yaxis.set_minor_locator(plticker.MultipleLocator(base=0.5 / 5.))
for ymaj in ax.yaxis.get_majorticklocs():
        ax.axhline(y=ymaj, ls='-', color='red', linewidth=0.8)
for ymin in ax.yaxis.get_minorticklocs():
    ax.axhline(y=ymin, ls=':', color='red', linewidth=0.6)

ax.axis([0, 10, -ylim, ylim])
fig.tight_layout()

# Plot
ax.plot(data)

# Set equal aspect ratio NOT WORKING
plt.gca().set_aspect('equal', adjustable='box')
plt.show()
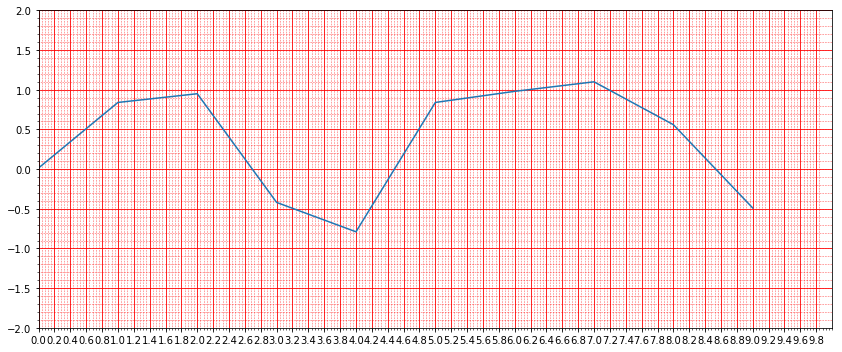
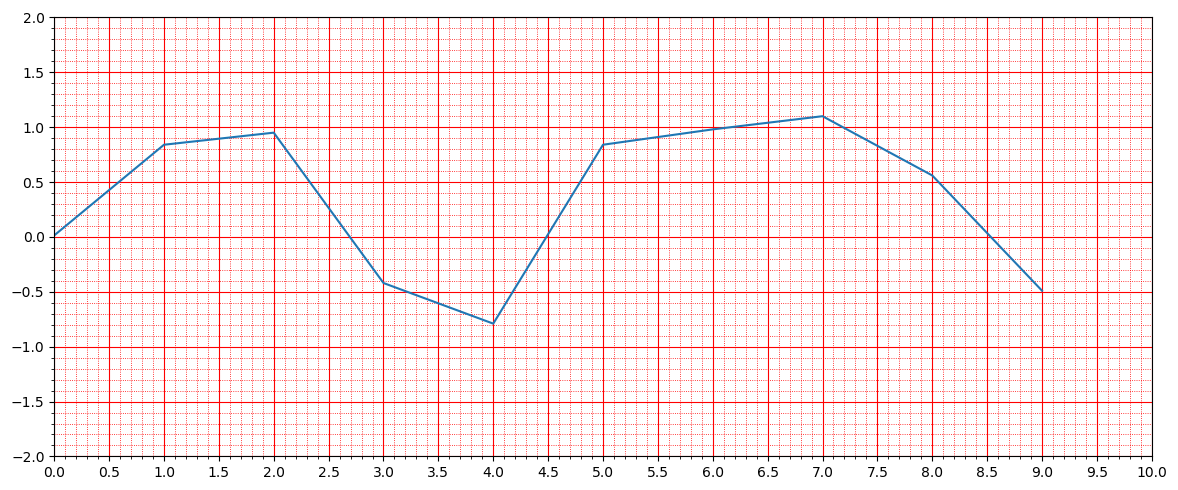
Which generates the following plot:

Large grid cells contain 5 smaller cells each. However, the aspect ratio of large grid is not 1. Question: How can I make sure that large grid is square?
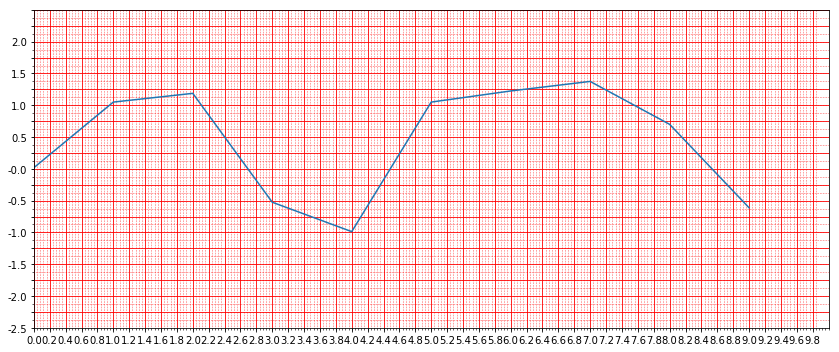
EDIT Current approach is to set same tick locations as suggested by @ImportanceOfBeingErnest, but change Y labels:
ylim = int(np.ceil(max(abs(min(data)), max(data))))
yticks = np.arange(-ylim, ylim + 0.2, 0.2)

ax.set_yticks(yticks)

labels = ['{:.1f}'.format(v if abs(v) < 1e-3 else (1 if v > 0 else -1)*((0.5 - abs(v)%0.5) + abs(v)))
          if i%2==0 else "" for i, v in enumerate(np.arange(-ylim, ylim, 0.2))]
ax.set_yticklabels(labels)


