It appears:
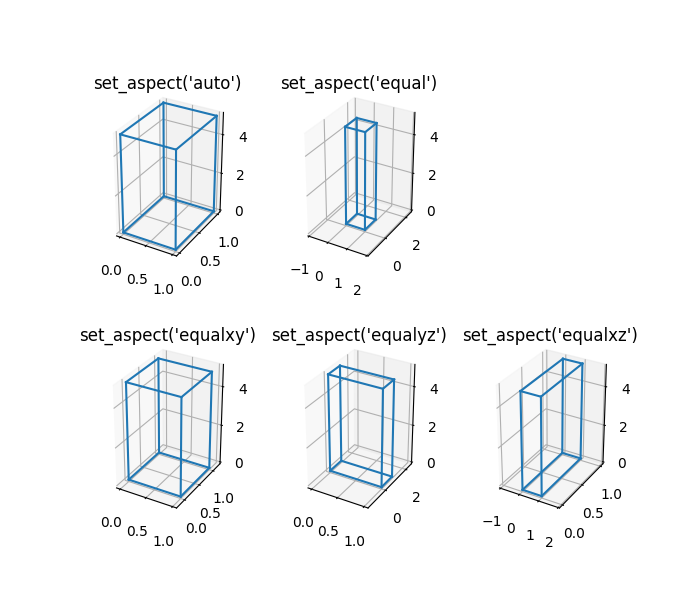
ax.set_aspect('equal')
works, but be careful to execute this instruction only when all plots are done. The code modifies the limits of the plot based on the ranges that have been used, and therefore would not calculate accurate limits if the subplot is not complete.
Documentation: mpl_toolkits.mplot3d.axes3d.Axes3D.set_aspect
![enter image description here]()
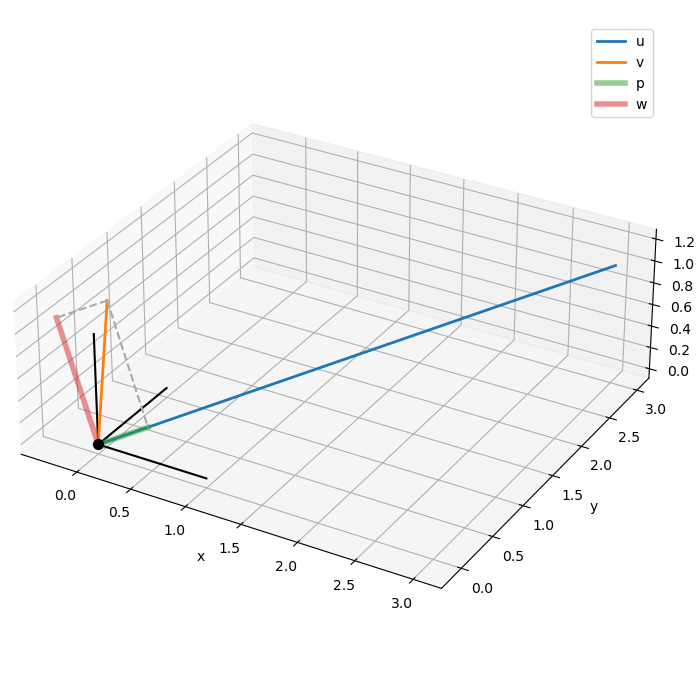
The three unit vectors in black have an equal length, in spite of the very different ranges for each axis.
Code used
It is interesting to look at the code.
view_intervals = np.array([self.xaxis.get_view_interval(),
                           self.yaxis.get_view_interval(),
                           self.zaxis.get_view_interval()])
ptp = np.ptp(view_intervals, axis=1)
if self._adjustable == 'datalim':
...
else:  # 'box'
    # Change the box aspect such that the ratio of the length of
    # the unmodified axis to the length of the diagonal
    # perpendicular to it remains unchanged.
    box_aspect = np.array(self._box_aspect)
    box_aspect[ax_indices] = ptp[ax_indices]
    remaining_ax_indices = {0, 1, 2}.difference(ax_indices)
    if remaining_ax_indices:
        remaining = remaining_ax_indices.pop()
        old_diag = np.linalg.norm(self._box_aspect[ax_indices])
        new_diag = np.linalg.norm(box_aspect[ax_indices])
        box_aspect[remaining] *= new_diag / old_diag
    self.set_box_aspect(box_aspect)
Example
The code corresponding to the figure above.
import numpy as np
import matplotlib.pyplot as plt


# Convert a point array to arrays of x, y and z coords
def split_xyz(points):
    _p = np.asarray(points)
    return _p[:,0], _p[:,1], _p[:,2]

# Origin
o = np.array([0,0,0])

# Vectors
u = np.array([3,3,1])
v = np.array([0,0.2,1.2])

# Projection of v onto u
n = np.linalg.norm(u)
p = u.dot(v) / n**2 * u

# Projection of v onto plane normal to u
w = v - p

# Figure
kw = dict(figsize=(7,7), layout='constrained')
fig = plt.figure(**kw)
mosaic = [['3d']]
kw = {'3d': dict(projection = '3d')}
axs = fig.subplot_mosaic(mosaic, per_subplot_kw=kw)
ax = axs['3d']

# Plot origin
ax.scatter([0],[0],[0], s=50, c='k')
ax.set_xlabel('x')
ax.set_ylabel('y')
ax.set_zlabel('z')

# Plot unit vectors
units = [(1,0,0), (0,1,0),(0,0,1)]
for _v in units: ax.plot(*split_xyz([o, _v]), c='k')

# Plot vectors
for _v, label in zip([u,v], ['u','v']):
    ax.plot(*split_xyz([o, _v]), label=label, lw=2)

# Plot projections
for _v, label in zip([p,w], ['p','w']):
    ax.plot(*split_xyz([o, _v]), label=label, lw=4, alpha=0.5)

# Plot projection lines
for _v in [p, w]: ax.plot(*split_xyz([v, _v]), c='darkgray', ls='--')

# Add legend
ax.legend()

ax.set_aspect('equal')


set_box_aspect(). See the newer answers below. – Plumset_box_aspectso that it works with matplotlib 3.3.0 and later. – Kussell