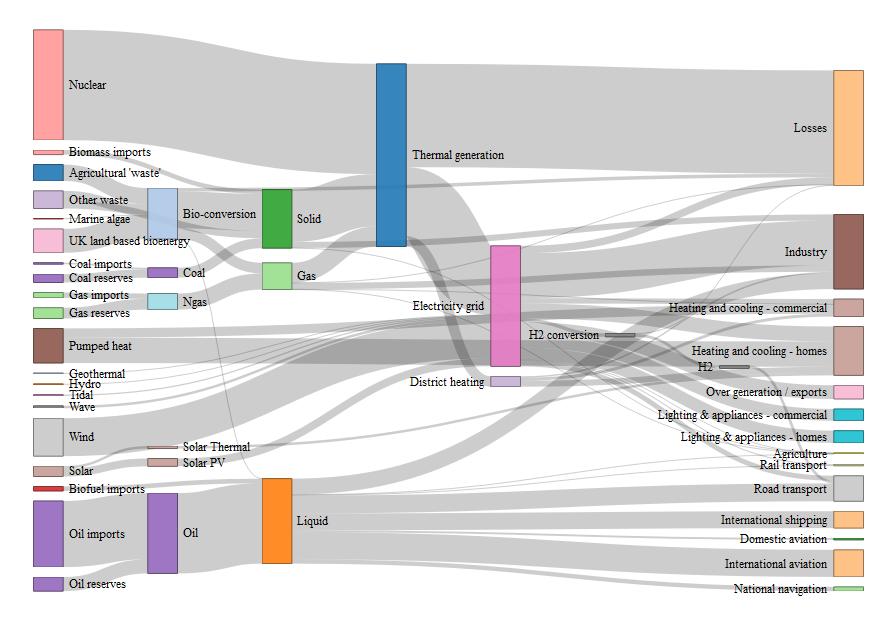
Attempting to make a fairly generic Sankey diagram with the help of R's networkD3 package. Just for reference--here's the example from the package's manual
library(networkD3)
library(jsonlite)
library(magrittr)

energy <- "https://cdn.rawgit.com/christophergandrud/networkD3/master/JSONdata/energy.json" %>%
      fromJSON

sankeyNetwork(Links = energy$links,
              Nodes = energy$nodes,
              Source = "source",
              Target = "target",
              Value = "value",
              NodeID = "name",
              units = "TWh",
              fontSize = 12,
              nodeWidth = 30)
which results in:
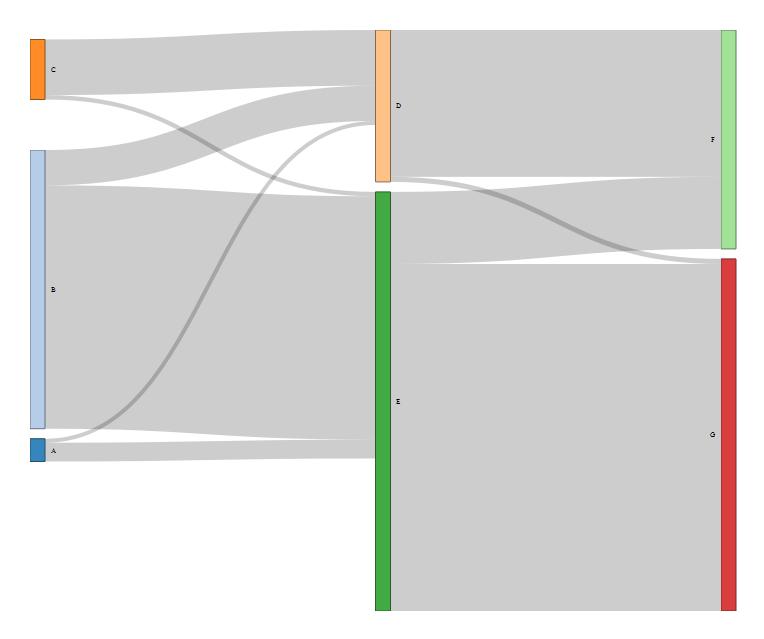
My fairly straightforward extension consists of building a diagram with the following underlying data:
links <- structure(list(source = structure(c(1L, 2L, 3L, 1L, 2L, 3L, 4L,
                                         5L, 4L, 5L),
                                       .Label = c("1", "2", "3", "4", "5"),
                                       class = "factor"),
                    target = structure(c(1L, 1L, 1L, 2L, 2L, 2L, 3L, 3L, 4L,
                                         4L),
                                       .Label = c("4", "5", "6", "7"),
                                       class = "factor"),
                    value = c(88L, 774L, 1220L, 412L, 5335L, 96L, 3219L,
                              1580L, 111L, 7607L)),
               row.names = c(NA, 10L),
               class = "data.frame",
               .Names = c("source", "target", "value"))

nodes <- structure(list(lab = c("A", "B", "C", "D", "E", "F", "G")),
               row.names = c(NA, -7L),
               .Names = "lab", class = "data.frame")
with this simple application chosen so that my data most closely reflects the manual example. When I run the comparable function, though:
sankeyNetwork(Links = links,
              Nodes = nodes,
              Source = "source",
              Target = "target",
              Value = "value",
              NodeID = "lab")
Nothing happens. What's my mistake?


