How to visualize Loki JSON logs in Grafana
Asked Answered
I

2

9

So we are using Loki/Grafana to collect logs from our Kubernetes cluster, and the tool is great for that. But now that I have cleaned up the logs, I would also like to visualize them!

  1. My logs enter image description here

  2. Selecting only JSON lines

    # My query
    {namespace="default",pod=~"kkds-dockerscanner-test.+"} |= "SchemaVersion" | json
    
    My logs

    enter image description here

  3. I select only two columns that I want to display in a table

    {namespace="default",pod=~"kkds-dockerscanner-test.+"} |= "SchemaVersion" | json | line_format "{{.ArtifactName}} {{.Metadata_OS_Family}}"
    
  4. Now I want to show the results in a table, but Grafana doesn't quite show the table I want. I want to show the output of my query in a table, and not just my output as a string in a column. Do you have any suggestions how to make this work, or can you point to a tutorial?

    enter image description here

Isomerize answered 31/5, 2022 at 9:50 Comment(6)
Loki has no concept of JSON contained within a log message. For Loki, it is a string. Will have to think about it…Ize
Ok, apparently, I missed the logQL part. As far as I can see from the docs, the return value for line expected is always supposed to be a single field. So we are down to taking the log line and using its fields as labels. Have an idea, but this will take some time.Ize
In section 2 I have already broken the JSON down to line-by-line, so Grafana should eat the data :)Isomerize
Well, yeah, theoretically we have identified the labels... So they SHOULD be available for column mapping... But it has been a while, and I'd need to do a test set to verify.Ize
I have run into a few blog posts and videos where they show that you can set up Grafana with a REST API, and that the returned JSON data is easily digested. That is why it confuses me that the JSON in an identical format returned from a query cannot be digested. Here is the video, where Grafana digests JSON lines: youtube.com/watch?v=Wmgs1E9Ry-sIsomerize
I know how it works in general. Simply adding a |json works for me for identifying the labels. However, as far as I understand you, you want (some) labels to be shown as columns, right?Ize
I
7

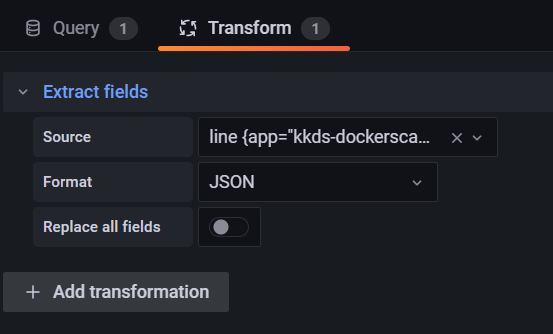
As suggested by @Witt, it is possible to transform the JSON by applying a transformation.

If I choose the Transform pane and extract fields, I now get the JSON keys as columns in the Table view.

enter image description here

Under your datasource, you can also add the columns using Derived Fields and Regex. This, however, is a bit more cumbersome.

enter image description here

Isomerize answered 10/6, 2022 at 12:58 Comment(0)
M
2

You'll need to apply a transform on the data before it's visualized.

I don't have an instance available to me to test so I can't send screenshots, but this is how you'd get the data out of the "line {}" column.

Meson answered 9/6, 2022 at 14:7 Comment(0)

© 2022 - 2024 — McMap. All rights reserved.