PLEASE NOTE: This question was successfully answered ptrj below. I have also written a blog post on my blog about my experiences with zipline which you can find here: https://financialzipline.wordpress.com
I'm based in South Africa and I'm trying to load South African shares into a dataframe so that it will feed zipline with share price information. Let's say I'm looking at AdCorp Holdings Limited as listed on the JSE (Johannesburg Stock Exchange):
Google Finance gives me the historical price info:
https://www.google.com/finance/historical?q=JSE%3AADR&ei=5G6OV4ibBIi8UcP-nfgB
Yahoo Finance has no information on the company.
https://finance.yahoo.com/quote/adcorp?ltr=1
Typing in the following code within iPython Notebook gets me the dataframe for the information from Google Finance:
start = datetime.datetime(2016,7,1)
end = datetime.datetime(2016,7,18)
f = web.DataReader('JSE:ADR', 'google',start,end)
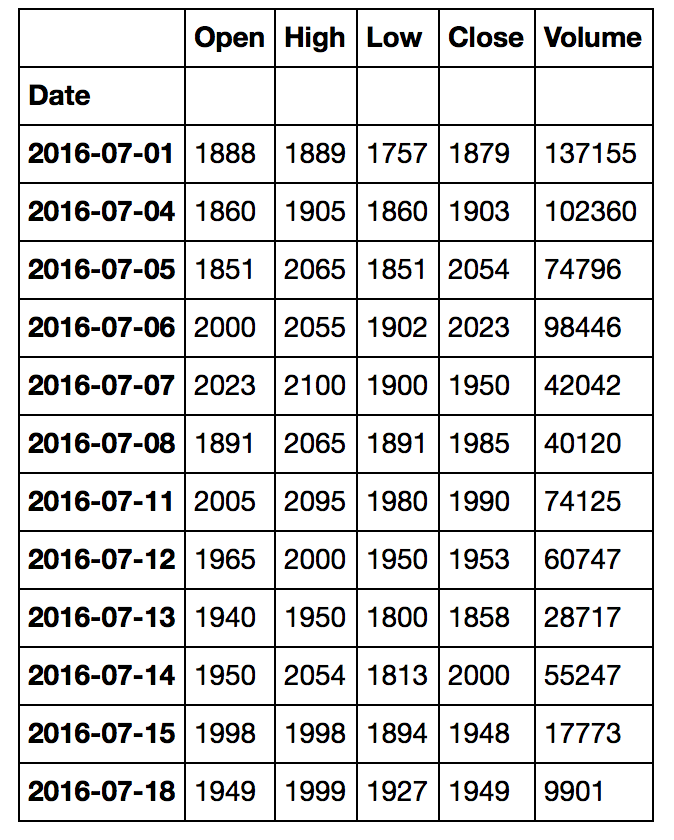
If I display f, I see that the information actually corresponds to the info off Google Finance as well:
This is the price exactly off Google Finance, you can see the info for the 2016-07-18 on the Google Finance website matches exactly to my dataframe.
However, I'm not sure how to load this dataframe so that it can be used by zipline as a data bundle.
If you look at the example given for buyapple.py, you can see that it just pulls the data of apple shares (APPL) from the ingested data bundle quantopian-quandl. The challenge here is to replace APPL with JSE:ADR so that it will order 10 JSE:ADR shares a day as fed from the dataframe instead of the data bundle quantopian-quandl and plot it on a graph.
Does anyone know how to do this? There are almost no examples on the net that deals with this...
This is the buyapple.py code as supplied in zipline's example folder:
from zipline.api import order, record, symbol


def initialize(context):
    pass


def handle_data(context, data):
    order(symbol('AAPL'), 10)
    record(AAPL=data.current(symbol('AAPL'), 'price'))


# Note: this function can be removed if running
# this algorithm on quantopian.com
def analyze(context=None, results=None):
    import matplotlib.pyplot as plt
    # Plot the portfolio and asset data.
    ax1 = plt.subplot(211)
    results.portfolio_value.plot(ax=ax1)
    ax1.set_ylabel('Portfolio value (USD)')
    ax2 = plt.subplot(212, sharex=ax1)
    results.AAPL.plot(ax=ax2)
    ax2.set_ylabel('AAPL price (USD)')

    # Show the plot.
    plt.gcf().set_size_inches(18, 8)
    plt.show()


def _test_args():
    """Extra arguments to use when zipline's automated tests run this example.
    """
    import pandas as pd

    return {
        'start': pd.Timestamp('2014-01-01', tz='utc'),
        'end': pd.Timestamp('2014-11-01', tz='utc'),
    }
EDIT:
I looked at the code for ingesting the data from Yahoo Finance and modified it a little to make it take on Google Finance data. The code for the Yahoo Finance can be found here: http://www.zipline.io/_modules/zipline/data/bundles/yahoo.html.
This is my code to ingest Google Finance - sadly it is not working. Can someone more fluent in python assist me?:
import os

import numpy as np
import pandas as pd
from pandas_datareader.data import DataReader
import requests

from zipline.utils.cli import maybe_show_progress


def _cachpath(symbol, type_):
    return '-'.join((symbol.replace(os.path.sep, '_'), type_))


def google_equities(symbols, start=None, end=None):
    """Create a data bundle ingest function from a set of symbols loaded from
    yahoo.

    Parameters
    ----------
    symbols : iterable[str]
        The ticker symbols to load data for.
    start : datetime, optional
        The start date to query for. By default this pulls the full history
        for the calendar.
    end : datetime, optional
        The end date to query for. By default this pulls the full history
        for the calendar.

    Returns
    -------
    ingest : callable
        The bundle ingest function for the given set of symbols.

    Examples
    --------
    This code should be added to ~/.zipline/extension.py

    .. code-block:: python

       from zipline.data.bundles import yahoo_equities, register

       symbols = (
           'AAPL',
           'IBM',
           'MSFT',
       )
       register('my_bundle', yahoo_equities(symbols))

    Notes
    -----
    The sids for each symbol will be the index into the symbols sequence.
    """
    # strict this in memory so that we can reiterate over it
    symbols = tuple(symbols)

    def ingest(environ,
               asset_db_writer,
               minute_bar_writer,  # unused
               daily_bar_writer,
               adjustment_writer,
               calendar,
               cache,
               show_progress,
               output_dir,
               # pass these as defaults to make them 'nonlocal' in py2
               start=start,
               end=end):
        if start is None:
            start = calendar[0]
        if end is None:
            end = None

        metadata = pd.DataFrame(np.empty(len(symbols), dtype=[
            ('start_date', 'datetime64[ns]'),
            ('end_date', 'datetime64[ns]'),
            ('auto_close_date', 'datetime64[ns]'),
            ('symbol', 'object'),
        ]))

        def _pricing_iter():
            sid = 0
            with maybe_show_progress(
                    symbols,
                    show_progress,
                    label='Downloading Google pricing data: ') as it, \
                    requests.Session() as session:
                for symbol in it:
                    path = _cachpath(symbol, 'ohlcv')
                    try:
                        df = cache[path]
                    except KeyError:
                        df = cache[path] = DataReader(
                            symbol,
                            'google',
                            start,
                            end,
                            session=session,
                        ).sort_index()

                    # the start date is the date of the first trade and
                    # the end date is the date of the last trade
                    start_date = df.index[0]
                    end_date = df.index[-1]
                    # The auto_close date is the day after the last trade.
                    ac_date = end_date + pd.Timedelta(days=1)
                    metadata.iloc[sid] = start_date, end_date, ac_date, symbol

                    df.rename(
                        columns={
                            'Open': 'open',
                            'High': 'high',
                            'Low': 'low',
                            'Close': 'close',
                            'Volume': 'volume',
                        },
                        inplace=True,
                    )
                    yield sid, df
                    sid += 1

        daily_bar_writer.write(_pricing_iter(), show_progress=True)

        symbol_map = pd.Series(metadata.symbol.index, metadata.symbol)
        asset_db_writer.write(equities=metadata)

        adjustment_writer.write(splits=pd.DataFrame(), dividends=pd.DataFrame())
        # adjustments = []
        # with maybe_show_progress(
        #         symbols,
        #         show_progress,
        #         label='Downloading Google adjustment data: ') as it, \
        #         requests.Session() as session:
        #     for symbol in it:
        #         path = _cachpath(symbol, 'adjustment')
        #         try:
        #             df = cache[path]
        #         except KeyError:
        #             df = cache[path] = DataReader(
        #                 symbol,
        #                 'google-actions',
        #                 start,
        #                 end,
        #                 session=session,
        #             ).sort_index()

        #         df['sid'] = symbol_map[symbol]
        #         adjustments.append(df)

        # adj_df = pd.concat(adjustments)
        # adj_df.index.name = 'date'
        # adj_df.reset_index(inplace=True)

        # splits = adj_df[adj_df.action == 'SPLIT']
        # splits = splits.rename(
        #     columns={'value': 'ratio', 'date': 'effective_date'},
        # )
        # splits.drop('action', axis=1, inplace=True)

        # dividends = adj_df[adj_df.action == 'DIVIDEND']
        # dividends = dividends.rename(
        #     columns={'value': 'amount', 'date': 'ex_date'},
        # )
        # dividends.drop('action', axis=1, inplace=True)
        # # we do not have this data in the yahoo dataset
        # dividends['record_date'] = pd.NaT
        # dividends['declared_date'] = pd.NaT
        # dividends['pay_date'] = pd.NaT

        # adjustment_writer.write(splits=splits, dividends=dividends)

    return ingest


