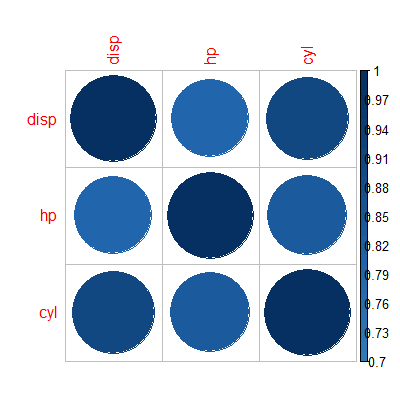
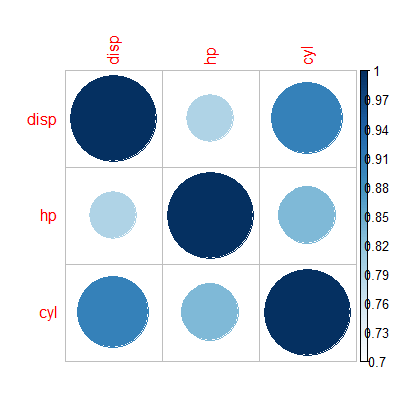
I am using corrplot in R to plot a correlation-coefficient matrix, but my correlations range only from 0.95 to 1.00, and I don't know how to set the lower and upper bounds of colors palette.
corrplot(segCorr, order = "hclust", tl.cex = .6,
         cl.lim = c(0.95, 1), col=colorRampPalette(c("blue","white","red"))(10))
Despite of the settings everything is in one color, but I need to see these small differences in details.


d = mvtnorm::rmvnorm(50, c(0,0, 0), matrix(c(1, 0.9, 0.9, 0.9, 1, 0.9, 0.9, 0.9, 1),3)) ; mypal = colorRampPalette(c("blue", "white", "red"))(10) ; color = rep(mypal, 100); corrplot(cor(d), order = "hclust", tl.cex = .6, cl.lim = c(0.85, 1),col=color)– Staten