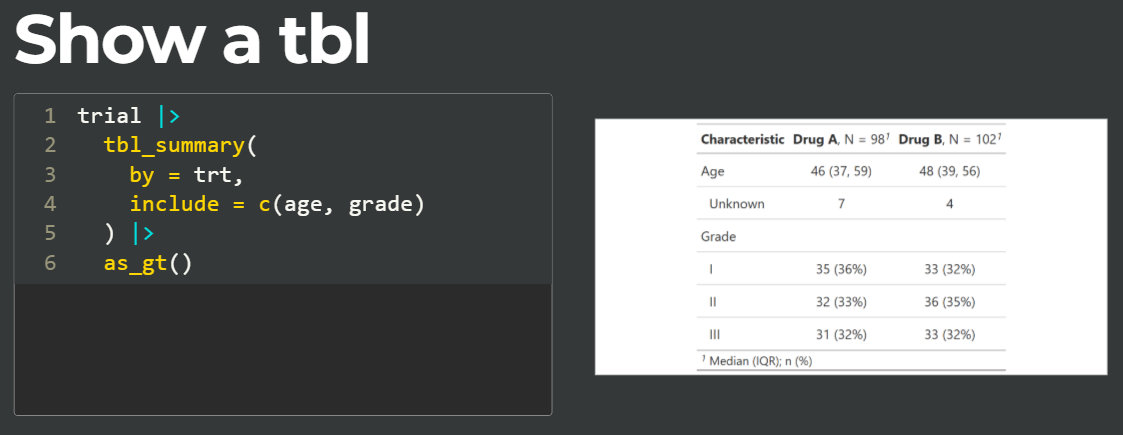
I am new to making revealjs slides using Quarto in R and RStudio. I would like to include a {gt} table (https://gt.rstudio.com/) on a slide with the default gt styling. But the issue I am running into is that the table is HTML and inherits custom CSS styling from the presentation CSS.
For example, here is what the rendered table looks like: the font is not the default gt font as well as a few other minor stylings.
---
format:
  revealjs:
    theme: [night]
    highlight-style: a11y
    transition: fade
    slide-number: true
    chalkboard: true
execute:
  freeze: auto
---
One thing I tried that got me close was overwriting the default knit_print() method for gt tables to 1. Convert the table to an image with gt::gtsave(), then 2. use the {magick} pkg to convert the image into a ggplot, then 3. knit_print() the ggplot. But it gave added white space on the left and right hand sides of the image.
library(tidyverse)
library(gtsummary)
library(knitr)

knit_print.gt_tbl <- function(x, ...) {
  # save gt as image -----------------------------------------------------------
  path_gt_table_image <- fs::file_temp(ext = "png")
  gt_table_image <- gt::gtsave(x, filename = path_gt_table_image, ...)

  # save image as ggplot -------------------------------------------------------
  table_img <-
    magick::image_read(path_gt_table_image) |>
    magick::image_ggplot(interpolate = TRUE)

  knitr::knit_print(table_img)
}

registerS3method("knit_print", "gt_tbl", knit_print.gt_tbl)
This method can work, but it seems a very round-about way to get the table into the presentation. Is there something better out there?


