JMH forks, threads and debug
Asked Answered
B

2

9

I started to work with JMH lately and wondered if there is a possible way to debug it.

First thing I did was try to debug it like any other program, but it threw "No transports initialized", so I couldn't debug it in the old fashioned way.

Next thing I did is to try to search on the internet and found someone who said that you need to put the forks to 0, tried it and it worked.

Unfortunately, I couldn't really understand why the forks are impacting the debug, or how forks impact the way I see things in the JMH. All I know so far is that when you put .forks(number) on the OptionBuilder it says on how many process the benchmark will run. But if I put .forks(3) it's running each @Benchmark method on 3 process async?

An explanation about the .forks(number), .threads(number) how they are changing the way benchmarks run and how they impact debug would really clear things.

Barabbas answered 9/3, 2017 at 14:59 Comment(0)
I
10

So normal JMH run has two processes running at any given time. The first ("host") process handles the run. The second ("forked") process is the process that runs one trial of a given benchmark -- achieving isolation. Requesting N forks either via annotation or command line (which takes precedence over annotations) makes N consecutive invocations for forked process. Requesting zero forks runs the workload straight in the hosted process itself.

So, there are two things to do with debugging:

a) Normally, you can attach to the forked process, and debug it there. It helps to configure workload to run longer to have plenty of time to attach and look around. The forked process usually has ForkedMain as its entry point, visible in jps.

b) If the thing above does not work, ask -f 0, and attach to the host process itself.

Intreat answered 9/3, 2017 at 19:4 Comment(0)
G
1

This was quite a pain in the soft side to get to work (now that I wrote this, it sounds trivial)

First of all I was trying to debug DTraceAsmProfiler (perfasm, but for Mac), using gradle.

First of all, I have a gradle task called jmh that looks like this:

task jmh(type: JavaExec, dependsOn: jmhClasses) {
    // the actual class to run
    main = 'com.eugene.AdditionPollution'
    classpath = sourceSets.jmh.compileClasspath + sourceSets.jmh.runtimeClasspath

    // I build JMH from sources, thus need this
    repositories {
        mavenLocal()
        maven {
            url '/Users/eugene/.m2/repository'
        }
    }
}

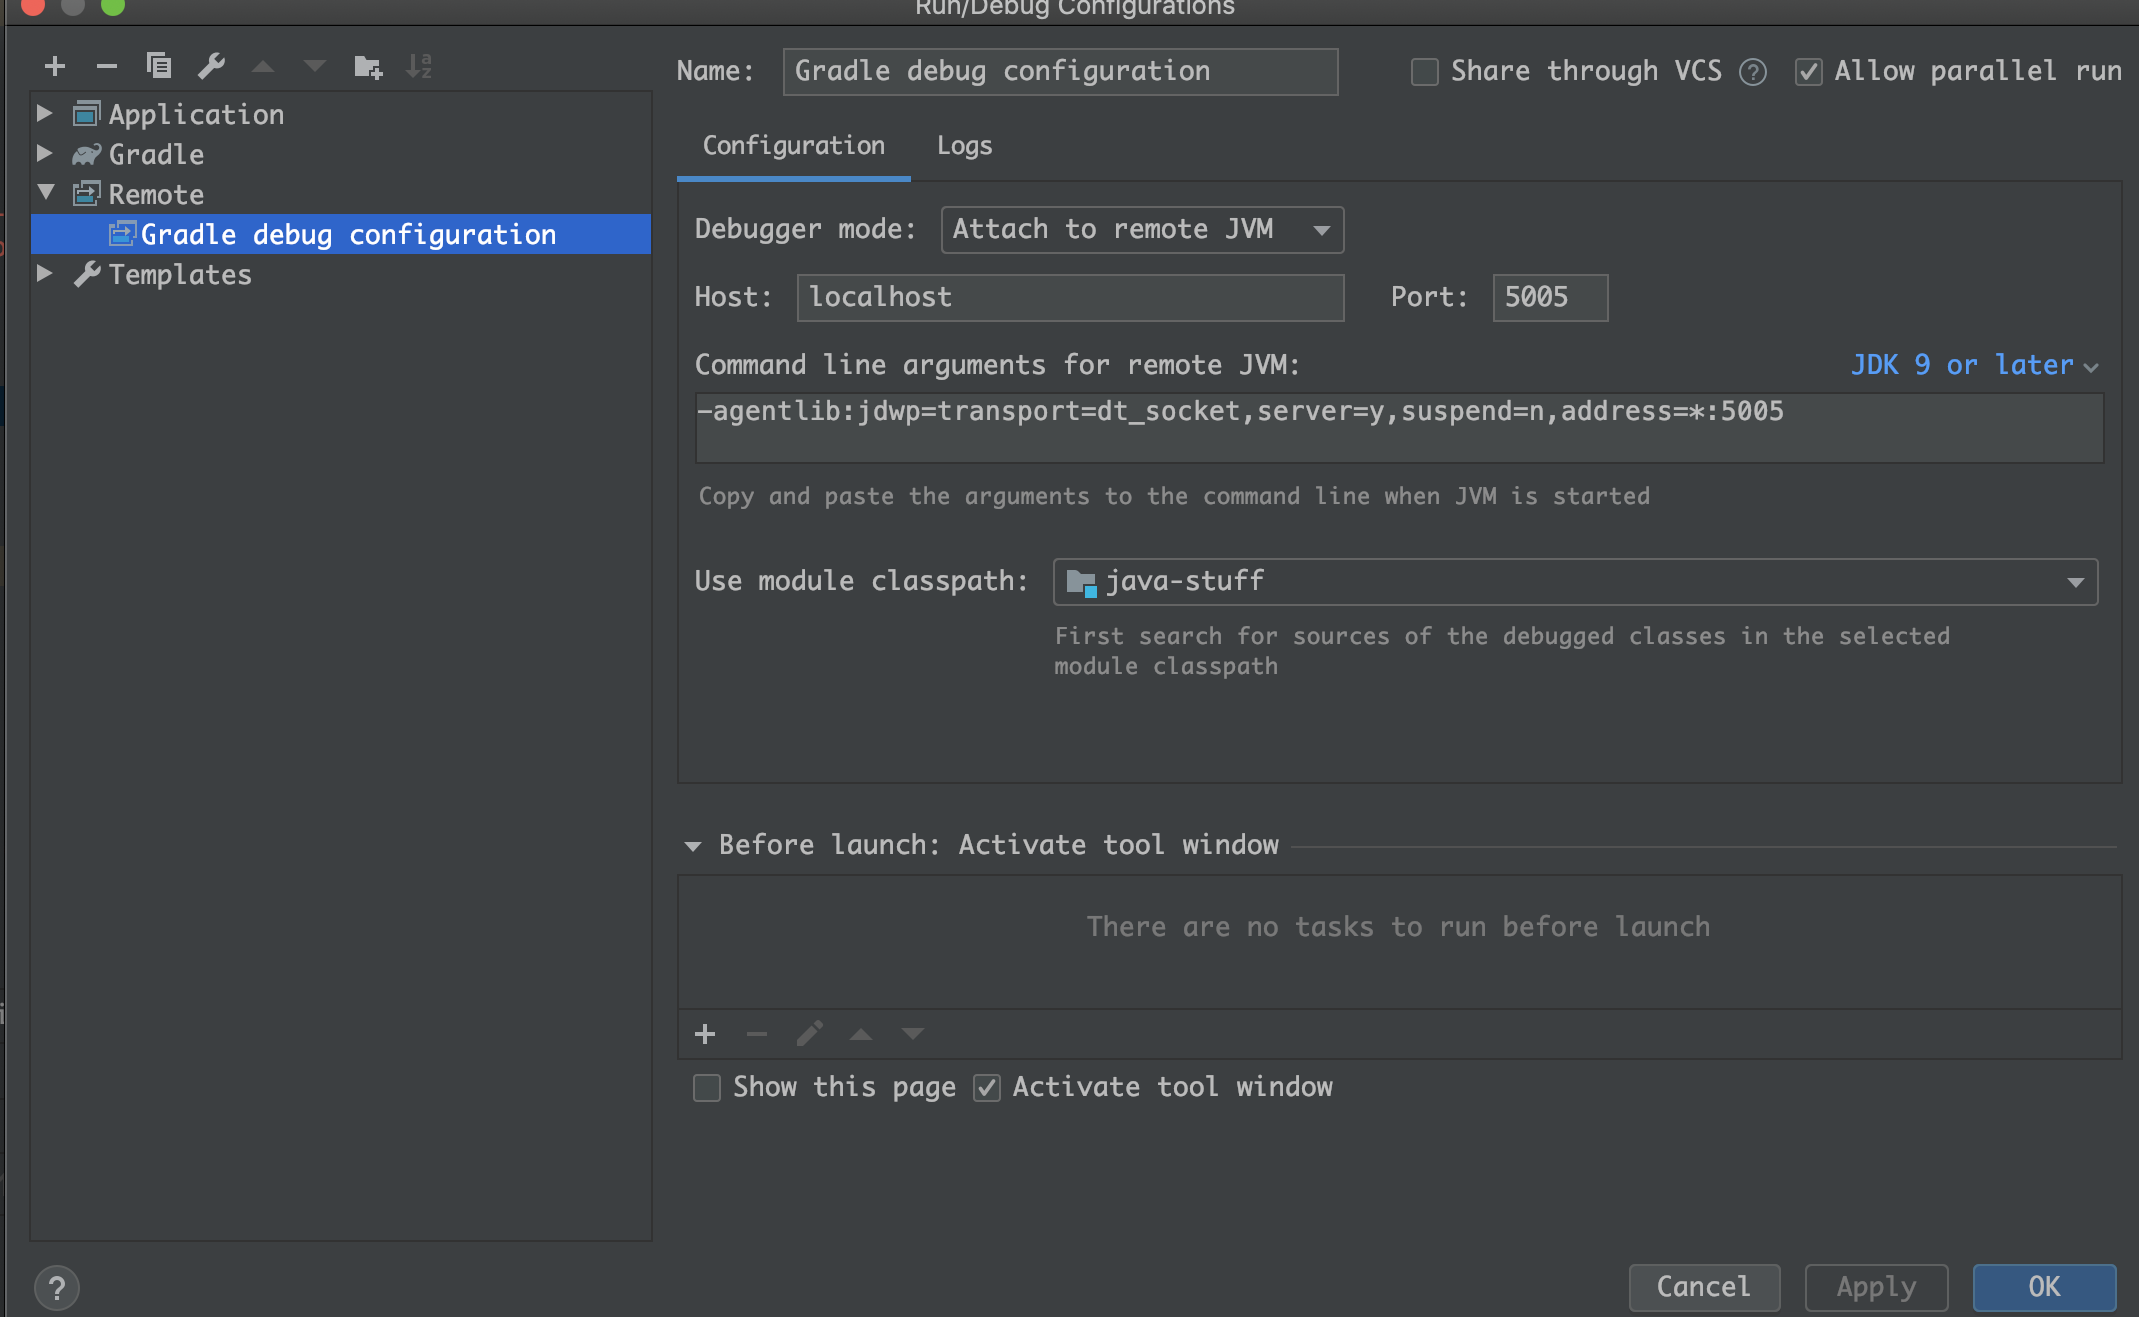
Then I needed to create a Debug Configuration in Intellij (nothing un-usual):

enter image description here

And then simply run:

sudo gradle -Dorg.gradle.debug=true jmh --debug-jvm
Gerent answered 16/2, 2020 at 4:4 Comment(0)

© 2022 - 2024 — McMap. All rights reserved.