Add text inside doughnut chart from chart js-2 in react
Asked Answered
H

1

9

i want to add a text message inside my doughnut pie chart. To be more specific i want something like this: enter image description here
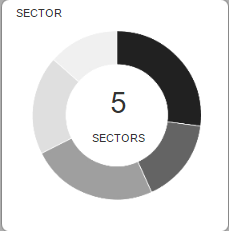
I came across the same issue here in stack overflow by they use chart js in jquery and since i'm new to javascript i got confused. This is how i define my pie chart:

<Doughnut
            data={sectorsData}
            width={250}
            height={250}
            options={{
              legend: {
                display: false
              },
              maintainAspectRatio: false,
              responsive: true,
              cutoutPercentage: 60
            }}
          />
Huntingdon answered 13/3, 2017 at 8:33 Comment(3)
Did you ever find a solution to this?Incogitant
@Incogitant I've added an exampleGeosphere
@user7334203 Did you managed to display sectors in new line ?Protuberant
G
11

My example uses the property text on the data to specify the inner text:

const data = {
  labels: [...],
  datasets: [...],
  text: '23%'
};

import React from 'react';
import ReactDOM from 'react-dom';
import {Doughnut} from 'react-chartjs-2';

// some of this code is a variation on https://jsfiddle.net/cmyker/u6rr5moq/
var originalDoughnutDraw = Chart.controllers.doughnut.prototype.draw;
Chart.helpers.extend(Chart.controllers.doughnut.prototype, {
  draw: function() {
    originalDoughnutDraw.apply(this, arguments);
    
    var chart = this.chart.chart;
    var ctx = chart.ctx;
    var width = chart.width;
    var height = chart.height;

    var fontSize = (height / 114).toFixed(2);
    ctx.font = fontSize + "em Verdana";
    ctx.textBaseline = "middle";

    var text = chart.config.data.text,
        textX = Math.round((width - ctx.measureText(text).width) / 2),
        textY = height / 2;

    ctx.fillText(text, textX, textY);
  }
});

const data = {
	labels: [
		'Red',
		'Green',
		'Yellow'
	],
	datasets: [{
		data: [300, 50, 100],
		backgroundColor: [
		'#FF6384',
		'#36A2EB',
		'#FFCE56'
		],
		hoverBackgroundColor: [
		'#FF6384',
		'#36A2EB',
		'#FFCE56'
		]
	}],
  text: '23%'
};

class DonutWithText extends React.Component {

  render() {
    return (
      <div>
        <h2>React Doughnut with Text Example</h2>
        <Doughnut data={data} />
      </div>
    );
  }
};

ReactDOM.render(
  <DonutWithText />,
  document.getElementById('root')
);
<script src="https://gor181.github.io/react-chartjs-2/common.js"></script>
<script src="https://gor181.github.io/react-chartjs-2/bundle.js"></script>

<div id="root">
</div>

You'll have to scroll down a bit to see in when running the CodeSnippet due to some weird console error.

It works properly in CodePen though, where I wrote it: http://codepen.io/anon/pen/OpdBOq?editors=1010

Geosphere answered 3/4, 2017 at 3:13 Comment(8)
Great answer but this is not the exact case. My layout is differentHuntingdon
@K Scandrett Can you explain where did u get Chart in code ??? var originalDoughnutDraw = Chart.controllers.doughnut.prototype.draw; ?Clyburn
@Shahnad Chart comes from the react-chartjs-2 libraryGeosphere
@Django Code snippet above works - if you scroll down (and ignore the SO security error). To make Codepen work again (I think they have removed the script references) just add the script references from above into the HTML <script src="https://gor181.github.io/react-chartjs-2/common.js"></script> <script src="https://gor181.github.io/react-chartjs-2/bundle.js"></script><div id="root"> </div>Geosphere
When i am trying to use this example. I am getting 'Chart is not defined'. Any idea?Rebutter
@Rebutter sounds like you haven't imported react-chartjs-2.js or maybe importing it sometime after you're referencing itGeosphere
how do i change the color of the text in the middle? ctx.color = "#ffffff"; doesn't workChops
@Chops ctx.fillStyle = "#00f";Geosphere

© 2022 - 2024 — McMap. All rights reserved.