I'm running python 3.6.6-debug (installed via pyenv) and I've copied the associated libpython.py from cpython/Tools/gdb/libpython.py to ~/.config/gdb (with the v3.6.6 tag checked out).
In my .gdbinit I have:
source ~/.config/gdb/libpython.py
For simple processes I'm able to use py-list, py-bt, etc without issue, but the program I'm currently testing under py.test gives me this error for any python gdb helper command:
(gdb) py-list
Python Exception <class 'RuntimeError'> Type does not have a target.:
Error occurred in Python command: Type does not have a target.
What does this error mean and how do I fix it?
Update
I dug into libpython.py to see exactly how py-list/py-bt do their thing, and then manually ran the associated gdb python commands from within gdb to reproduce the problem and isolate exactly where in libpython.py the problem is occuring. After doing the debugging below I was able to get a more detailed traceback in gdb:
Traceback (most recent call last):
  File "<stdin>", line 1, in <module>
  File "~/git/cpython/Tools/gdb/libpython.py", line 916, in filename
  File "~/git/cpython/Tools/gdb/libpython.py", line 1158, in proxyval
RuntimeError: Type does not have a target.
The problem is triggered at libpython.py line 1158, which is
fields = gdb.lookup_type('PyUnicodeObject').target().fields()
This clarifies things: libpython.py gets the Type object for PyUnicodeObject and then tries to call the target method on it, but the Type object for PyUnicodeObject doesn't have a target. Per the gdb documentation:
— Function: Type.target ()
Return a new gdb.Type object which represents the target type of this type.
For a pointer type, the target type is the type of the pointed-to object. For an array type (meaning C-like arrays), the target type is the type of the elements of the array. For a function or method type, the target type is the type of the return value. For a complex type, the target type is the type of the elements. For a typedef, the target type is the aliased type.
If the type does not have a target, this method will throw an exception.
This definitely looks like a bug, although I can't find any mention of this problem anywhere else online, in the python issue tracker, or in the python commit history. I'm going to open an issue on the python tracker and see what the maintainers say (unless someone has run into this before and submits an answer).
How I debugged
Configure ptrace to allow debugging without sudo
$ sudo sh -c 'echo 0 > /proc/sys/kernel/yama/ptrace_scope
Determine the parent python process of the hung (multiprocessing) program
$ pstree -p -s 22391
systemd(1)───tmux(31719)───bash(5161)───py.test(22391)─┬─py.test(22478)
                                                       ├─py.test(24577)
                                                       ├─py.test(24578)
                                                       ├─python3.6(25427)
                                                       ├─python3.6(25545)
                                                       ├─python3.6(25546)
                                                       ├─python3.6(25547)
                                                       ├─python3.6(27376)───{python3.6}(27393)
                                                       ├─python3.6(30563)───{python3.6}(30580)
                                                       ├─{py.test}(27368)
                                                       ├─{py.test}(30562)
                                                       ├─{py.test}(629)
                                                       └─{py.test}(630)
(I simply guessed right in the above, using the pid of any of the running python processes for my program would have worked)
Attach to the parent process
$ gdb -p 22391
Determine the most recent python execution frame and switch to it
(gdb) bt 10
#0  0x00007fec7309a5d3 in select () at ../sysdeps/unix/syscall-template.S:84
#1  0x00007fec738692aa in pysleep (secs=50000000) at ./Modules/timemodule.c:1417
#2  0x00007fec738671a3 in time_sleep (self=0x7fec71a00458, obj=0x7fec6cf728b0) at ./Modules/timemodule.c:235
#3  0x00007fec7368513e in _PyCFunction_FastCallDict (func_obj=0x7fec719ff5f8, args=0x7fec406fac08, nargs=1, kwargs=0x0) at Objects/methodobject.c:209
#4  0x00007fec73685535 in _PyCFunction_FastCallKeywords (func=0x7fec719ff5f8, stack=0x7fec406fac08, nargs=1, kwnames=0x0) at Objects/methodobject.c:294
#5  0x00007fec7379ab0d in call_function (pp_stack=0x7ffc37032440, oparg=1, kwnames=0x0) at Python/ceval.c:4830
#6  0x00007fec737927ca in _PyEval_EvalFrameDefault (f=0x7fec406faa58, throwflag=0) at Python/ceval.c:3328
===> #7  0x00007fec7377eb3b in PyEval_EvalFrameEx (f=0x7fec406faa58, throwflag=0) at Python/ceval.c:754
#8  0x00007fec7363a208 in gen_send_ex (gen=0x7fec3d0b88d8, arg=0x0, exc=0, closing=0) at Objects/genobject.c:189
#9  0x00007fec7363bca6 in gen_iternext (gen=0x7fec3d0b88d8) at Objects/genobject.c:563
(More stack frames follow...)
(gdb) frame 7
#7  0x00007fec7377eb3b in PyEval_EvalFrameEx (f=0x7fec406faa58, throwflag=0) at Python/ceval.c:754
754     Python/ceval.c: No such file or directory.
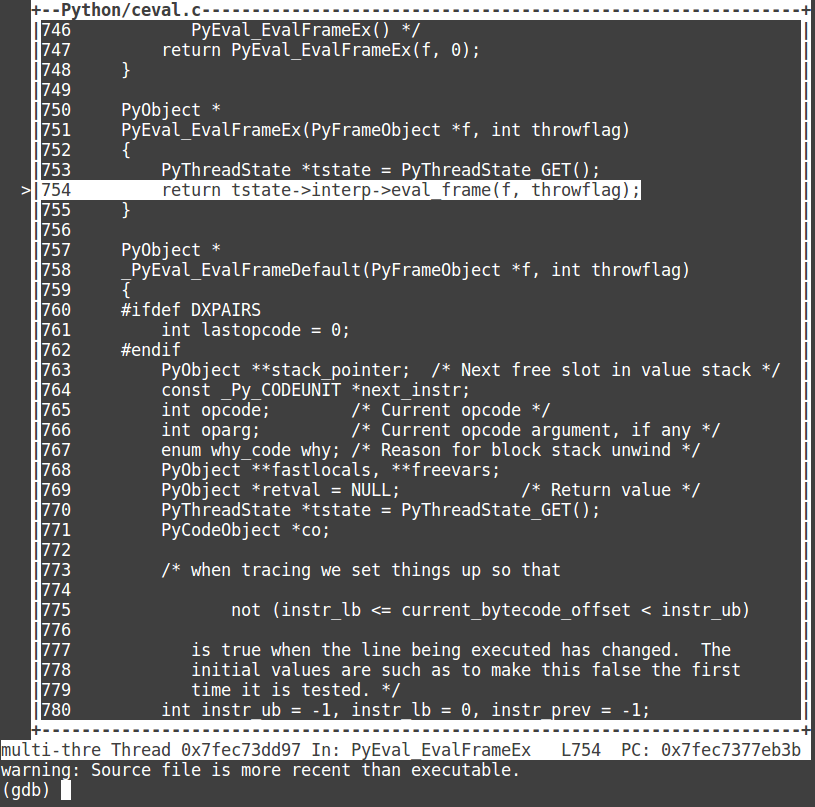
Add python source directories and use tui enable to get some context
(gdb) dir ~/git/cpython
Source directories searched: /home/calid/git/cpython:$cdir:$cwd
(gdb) tui enable
Start gdb's interactive python interpreter and manually enter libpython lines to get the current python script/line number
(gdb) pi
>>> gdbframe = gdb.selected_frame()
>>> f = gdbframe.read_var('f')
>>> pyframe = PyFrameObjectPtr.from_pyobject_ptr(f)
>>> pyframe.filename()
Traceback (most recent call last):
  File "<stdin>", line 1, in <module>
  File "~/git/cpython/Tools/gdb/libpython.py", line 916, in filename
  File "~/git/cpython/Tools/gdb/libpython.py", line 1158, in proxyval
RuntimeError: Type does not have a target.
This reproduced the exception I was seeing with py-list and py-bt, but this time I also got a very useful traceback with it.
Turn on gdb python stack traces by default
set python print-stack full
After all that I stumbled across documentation for the option above. Setting that turns on stack trace printing by default and would have avoided the need to do all that manual debugging... So in hindsight I did a lot of extra work I didn't need to do :) (although I did learn a lot in the process).
I've now added this to my gdbinit for the future.
Resources
- Debugging Python with gdb
- Low-level Python debugging with GDB (this one is amazing and massively helped me)
- Python’s Innards: Hello, ceval.c!


/usr/share/gdb/auto-load/usr/bin/python3.6-gdb.py– Mou