I am not using any libraries so this is not a duplicate of this.
I am drawing the pie sections myself like this:
var sections: [PieChartSection] = [] {
    didSet {
        setNeedsDisplay()
    }
}

override func draw(_ rect: CGRect) {
    let sumOfSections = sections.map { $0.value }.reduce(0, +)
    var pathStart = CGFloat.pi
    let smallerDimension = min(height, width)
    for section in sections {
        // draw section
        let percentage = section.value / sumOfSections
        let pathEnd = pathStart + CGFloat.pi * percentage.f * 2
        let path = UIBezierPath(arcCenter: CGPoint(x: bounds.midX, y: bounds.midY),
                                radius: smallerDimension / 4, startAngle: pathStart, endAngle: pathEnd, clockwise: true)

        //draw labels
        // this is my attempt at calculating the position of the labels
        let midAngle = (pathStart + pathEnd) / 2
        let textX = bounds.midX + smallerDimension * 3 / 8 * cos(midAngle)
        let textY = bounds.midY + smallerDimension * 3 / 8 * sin(midAngle)

        // creating the text to be shown, don't this is relevant
        let attributedString = NSMutableAttributedString(string: section.name, attributes: [
            .foregroundColor: UIColor.black.withAlphaComponent(0.15),
            .font: UIFont.systemFont(ofSize: 9)
            ])
        let formatter = NumberFormatter()
        formatter.maximumFractionDigits = 0
        let percentageString = "\n" + formatter.string(from: (percentage * 100) as NSNumber)! + "%"
        attributedString.append(NSAttributedString(string: percentageString, attributes: [
            .foregroundColor: UIColor.black.withAlphaComponent(0.5),
            .font: UIFont.systemFont(ofSize: 12)
            ]))
        attributedString.draw(at: CGPoint(x: textX, y: textY))

        // stroke path
        path.lineWidth = 6
        section.color.setStroke()
        path.stroke()
        pathStart = pathEnd
    }
}
And a PieChartSection is a simple struct:
struct PieChartSection {
    let value: Double
    let color: UIColor
    let name: String
}
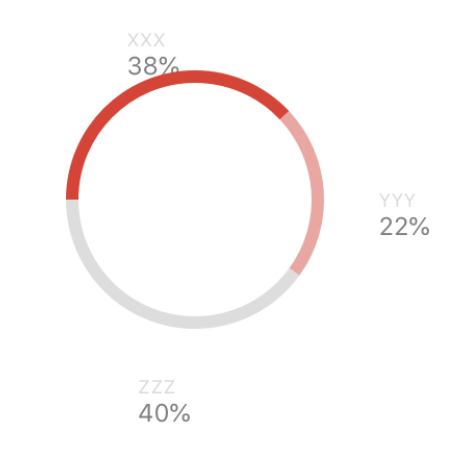
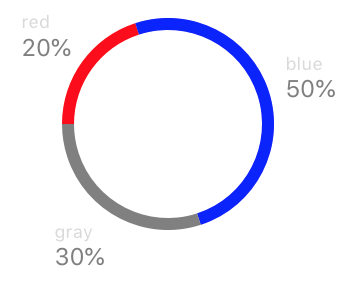
The pie looks good, but the labels are sometimes far away from the pie and sometimes very close to it:
I think the problem is that NSAttriutedString.draw always draws the text from the top left corner, meaning that the top left corners of the text are all equal-distance to the pie, whereas I need to draw the text so that their closest points to the pie are all equal-distance to the pie.
How can I draw text like that?
I am not using a cocoa pod because I find it very hard to make the chart the way I want using a high-level API. There is simply too much complexity involved. I want lower-level control over how my pie chart is drawn.


