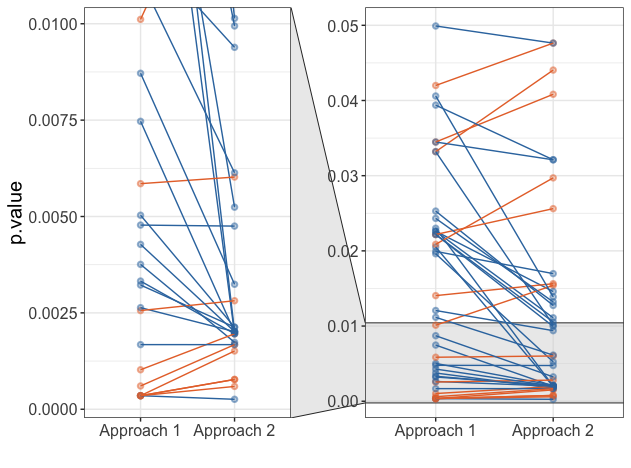
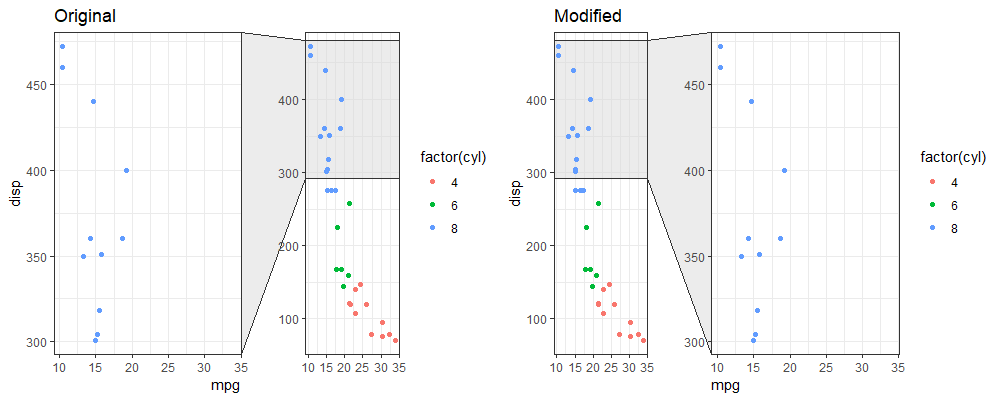
Coming back in 2024 to add an update that works with the newer ggforce_0.4.2 package and the same basics as Rodrigo Zepeda's answer above. Also having packages vctrs, gTable, plyr, grid, and lazyEval:
library(grid)
library(vctrs)
library(gTable)
library(plyr)
library(lazyEval)
library(ggforce)
library(ggplot2)
facet_zoom2 <- function(x, y, xy, zoom.data, xlim = NULL, ylim = NULL,
split = FALSE, horizontal = TRUE, zoom.size = 2,
show.area = TRUE, shrink = TRUE)
{x <- if (missing(x)) if (missing(xy)) NULL else enquo(xy) else enquo(x)
y <- if (missing(y)) if (missing(xy)) NULL else enquo(xy) else enquo(y)
zoom.data <- if (missing(zoom.data)) NULL else enquo(zoom.data)
if (is.null(x) && is.null(y) && is.null(xlim) && is.null(ylim))
{
cli::cli_abort('Either x- or y-zoom must be given')
}
if (!is.null(xlim)) x <- NULL
if (!is.null(ylim)) y <- NULL
ggproto(NULL, FacetZoom,
shrink = shrink,
params = list(
x = x, y = y, xlim = xlim, ylim = ylim, split = split,
zoom.data = zoom.data, zoom.size = zoom.size, show.area = show.area,
horizontal = horizontal
)
)
}
FacetZoom <- ggproto('FacetZoom', Facet,
compute_layout = function(data, params) {
layout <- data.frame(
name = c('orig', 'x', 'y', 'full', 'orig_true', 'zoom_true'),
SCALE_X = c(1L, 2L, 1L, 2L, 1L, 1L),
SCALE_Y = c(1L, 1L, 2L, 2L, 1L, 1L)
)
if (is.null(params$y) && is.null(params$ylim)) {
layout <- layout[c(1, 2, 5:6), ]
} else if (is.null(params$x) && is.null(params$xlim)) {
layout <- layout[c(1, 3, 5:6), ]
}
layout$PANEL <- seq_len(nrow(layout))
layout
},
map_data = function(data, layout, params) {
if (empty(data)) {
return(cbind(data, PANEL = integer(0)))
}
vec_rbind(
cbind(data, PANEL = 1L),
if (!is.null(params$x)) {
index_x <- try_fetch(eval_tidy(params$x, data),
error = function(e) FALSE)
if (sum(index_x, na.rm = TRUE) != 0) {
cbind(data[index_x, ], PANEL = layout$PANEL[layout$name == 'x'])
}
},
if (!is.null(params$y)) {
index_y <- try_fetch(eval_tidy(params$y, data),
error = function(e) FALSE)
if (sum(index_y, na.rm = TRUE) != 0) {
cbind(data[index_y, ], PANEL = layout$PANEL[layout$name == 'y'])
}
},
if (!is.null(params$zoom.data)) {
zoom_data <- try_fetch(eval_tidy(params$zoom.data, data),
error = function(e) NA)
zoom_data <- rep(zoom_data, length.out = nrow(data))
zoom_ind <- zoom_data | is.na(zoom_data)
orig_ind <- !zoom_data | is.na(zoom_data)
vec_rbind(
cbind(data[zoom_ind, ], PANEL = if (any(zoom_ind)) layout$PANEL[layout$name == 'zoom_true'] else integer(0)),
cbind(data[orig_ind, ], PANEL = if (any(orig_ind)) layout$PANEL[layout$name == 'orig_true'] else integer(0))
)
}
)
},
train_scales = function(self, x_scales, y_scales, layout, data, params) {
# Remove any limits settings on the zoom panels
if (length(x_scales) > 1) x_scales[[2]]$limits <- NULL
if (length(y_scales) > 1) y_scales[[2]]$limits <- NULL
# loop over each layer, training x and y scales in turn
for (layer_data in data) {
match_id <- match(layer_data$PANEL, layout$PANEL)
if (!is.null(x_scales)) {
if ('x' %in% layout$name && x_scales[[1]]$is_discrete()) {
cli::cli_abort('facet_zoom doesn\'t support zooming in discrete scales')
}
x_vars <- intersect(x_scales[[1]]$aesthetics, names(layer_data))
SCALE_X <- layout$SCALE_X[match_id]
if (!is.null(params$xlim) && length(x_scales) > 1) {
x_scales[[2]]$train(x_scales[[2]]$transform(params$xlim))
scale_apply(layer_data, x_vars, 'train', SCALE_X, x_scales[-2])
} else {
scale_apply(layer_data, x_vars, 'train', SCALE_X, x_scales)
}
}
if (!is.null(y_scales)) {
if ('y' %in% layout$name && y_scales[[1]]$is_discrete()) {
cli::cli_abort('facet_zoom doesn\'t support zooming in discrete scales')
}
y_vars <- intersect(y_scales[[1]]$aesthetics, names(layer_data))
SCALE_Y <- layout$SCALE_Y[match_id]
if (!is.null(params$ylim) && length(y_scales) > 1) {
y_scales[[2]]$train(y_scales[[2]]$transform(params$ylim))
scale_apply(layer_data, y_vars, 'train', SCALE_Y, y_scales[-2])
} else {
scale_apply(layer_data, y_vars, 'train', SCALE_Y, y_scales)
}
}
}
},
finish_data = function(data, layout, x_scales, y_scales, params) {
plot_panels <- which(!grepl('_true', layout$name))
data <- if (is.null(params$zoom.data)) {
vec_rbind(!!!lapply(layout$PANEL[plot_panels], function(panel) {
d <- data[data$PANEL == 1, ]
d$PANEL <- panel
d
}))
} else {
orig_pan <- layout$PANEL[layout$name == 'orig_true']
zoom_pan <- layout$PANEL[layout$name == 'zoom_true']
orig_data <- data[data$PANEL == orig_pan, ]
orig_data$PANEL <- if (nrow(orig_data) != 0) 1L else integer(0)
zoom_data <- data[data$PANEL == zoom_pan, ]
vec_rbind(orig_data, vec_rbind(!!!lapply(plot_panels[-1], function(panel) {
zoom_data$PANEL <- if (nrow(zoom_data) != 0) panel else integer(0)
zoom_data
})))
}
data$PANEL <- factor(data$PANEL, layout$PANEL)
data
},
draw_panels = function(self, panels, layout, x_scales, y_scales, ranges, coord,
data, theme, params) {
if (inherits(coord, 'CoordFlip')) {
cli::cli_abort('facet_zoom doesn\'t work with flipped scales')
}
if (is.null(params$x) && is.null(params$xlim)) {
params$horizontal <- TRUE
} else if (is.null(params$y) && is.null(params$ylim)) {
params$horizontal <- FALSE
}
zoom_x <- calc_element('zoom.x', theme)
zoom_y <- calc_element('zoom.y', theme)
# Construct the panels
axes <- render_axes(ranges, ranges, coord, theme, FALSE)
panelGrobs <- create_panels(panels, axes$x, axes$y)
panelGrobs <- panelGrobs[seq_len(length(panelGrobs) - 2)]
if ('full' %in% layout$name && !params$split) {
panelGrobs <- panelGrobs[c(1, 4)]
}
if ('y' %in% layout$name) {
if (!inherits(zoom_y, 'element_blank')) {
zoom_prop <- rescale(y_scales[[2]]$dimension(expansion(y_scales[[2]])),
from = y_scales[[1]]$dimension(expansion(y_scales[[1]]))
)
indicator <- polygonGrob(
c(0, 0, 1, 1),
c(zoom_prop, 1, 0),
gp = gpar(col = NA, fill = alpha(zoom_y$fill, 0.5))
)
lines <- segmentsGrob(
y0 = c(1, 1),
x0 = c(0, 1),
y1 = zoom_prop,
x1 = c(1, 1),
gp = gpar(
col = zoom_y$colour,
lty = zoom_y$linetype,
lwd = (zoom_y$linewidth %||% zoom_y$size) * .pt,
lineend = 'round'
)
)
indicator_h <- grobTree(indicator, lines)
} else {
indicator_h <- zeroGrob()
}
}
if ('x' %in% layout$name) {
if (!inherits(zoom_x, 'element_blank')) {
zoom_prop <- rescale(x_scales[[2]]$dimension(expansion(x_scales[[2]])),
from = x_scales[[1]]$dimension(expansion(x_scales[[1]]))
)
indicator <- polygonGrob(
c(zoom_prop, 1, 0),
c(1, 1, 0, 0),
gp = gpar(col = NA, fill = alpha(zoom_x$fill, 0.5))
)
lines <- segmentsGrob(
x0 = c(0, 1),
y0 = c(0, 0),
x1 = zoom_prop,
y1 = c(1, 1),
gp = gpar(
col = zoom_x$colour,
lty = zoom_x$linetype,
lwd = (zoom_x$linewidth %||% zoom_x$size) * .pt,
lineend = 'round'
)
)
indicator_v <- grobTree(indicator, lines)
} else {
indicator_v <- zeroGrob()
}
}
if ('full' %in% layout$name && params$split) {
space.x <- theme$panel.spacing.x
if (is.null(space.x)) space.x <- theme$panel.spacing
space.x <- unit(5 * as.numeric(convertUnit(space.x, 'cm')), 'cm')
space.y <- theme$panel.spacing.y
if (is.null(space.y)) space.y <- theme$panel.spacing
space.y <- unit(5 * as.numeric(convertUnit(space.y, 'cm')), 'cm')
final <- gtable_add_cols(panelGrobs[[3]], space.x)
final <- cbind(final, panelGrobs[[1]], size = 'first')
final_tmp <- gtable_add_cols(panelGrobs[[4]], space.x)
final_tmp <- cbind(final_tmp, panelGrobs[[2]], size = 'first')
final <- gtable_add_rows(final, space.y)
final <- rbind(final, final_tmp, size = 'first')
final <- gtable_add_grob(final, list(indicator_h, indicator_h), c(2, 6), 3,
c(2, 6), 5, z = -Inf, name = 'zoom-indicator')
final <- gtable_add_grob(final, list(indicator_v, indicator_v), 3, c(2, 6),
5, z = -Inf, name = 'zoom-indicator')
heights <- unit.c(
unit(max_height(list(axes$x[[1]]$top, axes$x[[3]]$top)), 'cm'),
unit(1, 'null'),
unit(max_height(list(axes$x[[1]]$bottom, axes$x[[3]]$bottom)), 'cm'),
space.y,
unit(max_height(list(axes$x[[2]]$top, axes$x[[4]]$top)), 'cm'),
unit(params$zoom.size, 'null'),
unit(max_height(list(axes$x[[2]]$bottom, axes$x[[4]]$bottom)), 'cm')
)
widths <- unit.c(
## unit(max_width(list(axes$y[[3]]$left, axes$y[[4]]$left)), 'cm'),
## unit(params$zoom.size, 'null'),
## unit(max_width(list(axes$y[[3]]$right, axes$y[[4]]$right)), 'cm'), space.x,
## unit(max_width(list(axes$y[[1]]$left, axes$y[[2]]$left)), 'cm'),
## unit(1, 'null'),
## unit(max_width(list(axes$y[[1]]$right, axes$y[[2]]$right)), 'cm')
unit(max_width(list(axes$y[[1]]$left, axes$y[[2]]$left)), 'cm'),
unit(1, 'null'),
unit(max_height(list(axes$y[[1]]$right, axes$y[[2]]$right)), 'cm'),
space.x,
unit(max_width(list(axes$y[[3]]$left, axes$y[[4]]$left)), 'cm'),
unit(params$zoom.size, 'null'),
unit(max_height(list(axes$y[[3]]$right, axes$y[[4]]$right)), 'cm')
)
final$heights <- heights
final$widths <- widths
} else {
if (params$horizontal) {
space <- theme$panel.spacing.x
if (is.null(space)) space <- theme$panel.spacing
space <- unit(5 * as.numeric(convertUnit(space, 'cm')), 'cm')
heights <- unit.c(
unit(max_height(list(axes$x[[1]]$top, axes$x[[2]]$top)), 'cm'),
unit(1, 'null'),
unit(max_height(list(axes$x[[1]]$bottom, axes$x[[2]]$bottom)), 'cm')
)
final <- gtable::gtable_add_cols(panelGrobs[[1]], space)
final <- cbind(final, panelGrobs[[2]], size = "first")
## final <- gtable_add_cols(panelGrobs[[2]], space)
## final <- cbind(final, panelGrobs[[1]], size = 'first')
final$heights <- heights
final$widths[panel_cols(final)$l] <- unit(c(1, params$zoom.size), 'null')
## final$widths[panel_cols(final)$l] <- unit(c(params$zoom.size, 1), 'null')
final <- gtable_add_grob(final, indicator_h, 2, 3, 2, 5, z = -Inf,
name = 'zoom-indicator')
} else {
space <- theme$panel.spacing.y
if (is.null(space)) space <- theme$panel.spacing
space <- unit(5 * as.numeric(convertUnit(space, 'cm')), 'cm')
widths <- unit.c(
unit(max_width(list(axes$y[[1]]$left, axes$y[[2]]$left)), 'cm'),
unit(1, 'null'),
unit(max_width(list(axes$y[[1]]$right, axes$y[[2]]$right)), 'cm')
)
final <- gtable_add_rows(panelGrobs[[1]], space)
final <- rbind(final, panelGrobs[[2]], size = 'first')
final$widths <- widths
final$heights[panel_rows(final)$t] <- unit(c(1, params$zoom.size), 'null')
final <- gtable_add_grob(final, indicator_v, 3, 2, 5, z = -Inf,
name = 'zoom-indicator')
}
}
final
},
draw_back = function(data, layout, x_scales, y_scales, theme, params) {
zoom_x <- calc_element('zoom.x', theme)
zoom_y <- calc_element('zoom.y', theme)
if (!(is.null(params$x) && is.null(params$xlim)) &&
params$show.area && !inherits(zoom_x, 'element_blank') && length(x_scales) > 1) {
zoom_prop <- rescale(x_scales[[2]]$dimension(expansion(x_scales[[2]])),
from = x_scales[[1]]$dimension(expansion(x_scales[[1]]))
)
x_back <- grobTree(
rectGrob(x = mean(zoom_prop), y = 0.5, width = diff(zoom_prop),
height = 1,
gp = gpar(col = NA, fill = alpha(zoom_x$fill, 0.5))),
segmentsGrob(zoom_prop, c(0, 0), zoom_prop, c(1, 1), gp = gpar(
col = zoom_x$colour,
lty = zoom_x$linetype,
lwd = (zoom_x$linewidth %||% zoom_x$size) * .pt,
lineend = 'round'
))
)
} else {
x_back <- zeroGrob()
}
if (!(is.null(params$y) && is.null(params$ylim)) &&
params$show.area && !inherits(zoom_y, 'element_blank') && length(y_scales) > 1) {
zoom_prop <- rescale(y_scales[[2]]$dimension(expansion(y_scales[[2]])),
from = y_scales[[1]]$dimension(expansion(y_scales[[1]]))
)
y_back <- grobTree(
rectGrob(y = mean(zoom_prop), x = 0.5, height = diff(zoom_prop),
width = 1,
gp = gpar(col = NA, fill = alpha(zoom_y$fill, 0.5))),
segmentsGrob(y0 = zoom_prop, x0 = c(0, 0), y1 = zoom_prop, x1 = c(1, 1),
gp = gpar(col = zoom_y$colour,
lty = zoom_y$linetype,
lwd = (zoom_y$linewidth %||% zoom_y$size) * .pt,
lineend = 'round'
)
)
)
} else {
y_back <- zeroGrob()
}
if ('full' %in% layout$name && params$split) {
list(grobTree(x_back, y_back), y_back, x_back, zeroGrob(), zeroGrob(),
zeroGrob())
} else {
list(grobTree(x_back, y_back), zeroGrob(), zeroGrob(), zeroGrob())
}
}
)
#' @importFrom grid grobHeight grobWidth unit unit.c
#' @importFrom gtable gtable gtable_add_grob
create_panels <- function(panels, x.axis, y.axis) {
Map(function(panel, x, y, i) {
heights <- unit.c(grobHeight(x$top), unit(1, 'null'), grobHeight(x$bottom))
widths <- unit.c(grobWidth(y$left), unit(1, 'null'), grobWidth(y$right))
table <- gtable(widths, heights)
table <- gtable_add_grob(table, panel, t = 2, l = 2, z = 2, clip = 'on',
name = paste0('panel-', i))
table <- gtable_add_grob(table, x, t = c(1, 3), l = 2, z = 4, clip = 'off',
name = paste0(c('axis-t-', 'axis-b-'), i))
table <- gtable_add_grob(table, y, t = 2, l = c(1, 3), z = 4, clip = 'off',
name = paste0(c('axis-l-', 'axis-r-'), i))
}, panel = panels, x = x.axis, y = y.axis, i = seq_along(panels))
}
expansion <- function(scale, discrete = c(0, 0.6), continuous = c(0.05, 0)) {
if (inherits(scale$expand, 'waiver')) {
if (scale$is_discrete()) {
discrete
} else {
continuous
}
} else {
scale$expand
}
}
# Helpers -----------------------------------------------------------------
split_with_index <- function(x, f, n = max(f)) {
if (n == 1) return(list(x))
f <- as.integer(f)
attributes(f) <- list(levels = as.character(seq_len(n)), class = "factor")
unname(split(x, f))
}
# Function for applying scale method to multiple variables in a given
# data set. Implement in such a way to minimize copying and hence maximise
# speed
scale_apply <- function(data, vars, method, scale_id, scales) {
if (length(vars) == 0) return()
if (nrow(data) == 0) return()
if (any(is.na(scale_id))) {
cli::cli_abort("{.arg scale_id} must not contain any {.val NA}")
}
scale_index <- split_with_index(seq_along(scale_id), scale_id, length(scales))
lapply(vars, function(var) {
pieces <- lapply(seq_along(scales), function(i) {
scales[[i]][[method]](data[[var]][scale_index[[i]]])
})
# Remove empty vectors to avoid coercion issues with vctrs
pieces[lengths(pieces) == 0] <- NULL
o <- order(unlist(scale_index))[seq_len(sum(lengths(pieces)))]
vec_c(!!!pieces)[o]
})
}


facet_zoom()with a categorical / discrete variable. Nice plots. – Samphire