Why we multiply 'most likely estimate' by 4 in three point estimation?
Asked Answered
W

5

9

I have used three point estimation for one of my project. Formula is

   Three Point Estimate = (O + 4M + L ) / 6

That means,

  Best Estimate + 4 x Most Likely Estimate + Worst Case Estimate divided by 6

Here

divided by 6 means, average 6

and there is less chance of the worst case or the best case happening. In good faith, most likely estimate (M), is what it will take to get the job done.

But I don't know why they use 4(M). Why they multiplied by 4 ???. Not use 5,6,7 etc... why most likely estimate is weighted four times as much as the other two values ?

Wraith answered 6/3, 2014 at 11:28 Comment(0)
R
6

There is a derivation here:

http://www.deepfriedbrainproject.com/2010/07/magical-formula-of-pert.html

In case the link goes dead, I'll provide a summary here.

So, taking a step back from the question for a moment, the goal here is to come up with a single mean (average) figure that we can say is the expected figure for any given 3 point estimate. That is to say, If I was to attempt the project X times, and add up all the costs of the project attempts for a total of $Y, then I expect the cost of one attempt to be $Y/X. Note that this number may or may not be the same as the mode (most likely) outcome, depending on the probability distribution.

An expected outcome is useful because we can do things like add up a whole list of expected outcomes to create an expected outcome for the project, even if we calculated each individual expected outcome differently.

A mode on the other hand, is not even necessarily unique per estimate, so that's one reason that it may be less useful than an expected outcome. For example, every number from 1-6 is the "most likely" for a dice roll, but 3.5 is the (only) expected average outcome.

The rationale/research behind a 3 point estimate is that in many (most?) real-world scenarios, these numbers can be more accurately/intuitively estimated by people than a single expected value:

  • A pessimistic outcome (P)
  • An optimistic outcome (O)
  • The most likely outcome (M)

However, to convert these three numbers into an expected value we need a probability distribution that interpolates all the other (potentially infinite) possible outcomes beyond the 3 we produced.

The fact that we're even doing a 3-point estimate presumes that we don't have enough historical data to simply lookup/calculate the expected value for what we're about to do, so we probably don't know what the actual probability distribution for what we're estimating is.

The idea behind the PERT estimates is that if we don't know the actual curve, we can plug some sane defaults into a Beta distribution (which is basically just a curve we can customise into many different shapes) and use those defaults for every problem we might face. Of course, if we know the real distribution, or have reason to believe that default Beta distribution prescribed by PERT is wrong for the problem at hand, we should NOT use the PERT equations for our project.

The Beta distribution has two parameters A and B that set the shape of the left and right hand side of the curve respectively. Conveniently, we can calculate the mode, mean and standard deviation of a Beta distribution simply by knowing the minimum/maximum values of the curve, as well as A and B.

PERT sets A and B to the following for every project/estimate:

If M > (O + P) / 2 then A = 3 + √2 and B = 3 - √2, otherwise the values of A and B are swapped.

Now, it just so happens that if you make that specific assumption about the shape of your Beta distribution, the following formulas are exactly true:

Mean (expected value) = (O + 4M + P) / 6

Standard deviation = (O - P) / 6

So, in summary

  • The PERT formulas are not based on a normal distribution, they are based on a Beta distribution with a very specific shape
  • If your project's probability distribution matches the PERT Beta distribution then the PERT formula are exactly correct, they are not approximations
  • It is pretty unlikely that the specific curve chosen for PERT matches any given arbitrary project, and so the PERT formulas will be an approximation in practise
  • If you don't know anything about the probability distribution of your estimate, you may as well leverage PERT as it's documented, understood by many people and relatively easy to use
  • If you know something about the probability distribution of your estimate that suggests something about PERT is inappropriate (like the 4x weighting towards the mode), then don't use it, use whatever you think is appropriate instead
  • The reason why you multiply by 4 to get the Mean (and not 5, 6, 7, etc.) is because the number 4 is tied to the shape of the underlying probability curve
  • Of course, PERT could have been based off a Beta distribution that yields 5, 6, 7 or any other number when calculating the Mean, or even a normal distribution, or a uniform distribution, or pretty much any other probability curve, but I'd suggest that the question of why they chose the curve they did is out of scope for this answer and possibly quite open ended/subjective anyway
Rebekah answered 31/7, 2016 at 15:21 Comment(1)
This is a far better answer than "I don't know so it's probably just made up".Pubilis
P
4

I dug into this once. I cleverly neglected to write down the trail, so this is from memory.

So far as I can make out, the standards documents got it from the textbooks. The textbooks got it from the original 1950s write up in a statistics journals. The writeup in the journal was based on an internal report done by RAND as part of the overall work done to develop PERT for the Polaris program.

And that's where the trail goes cold. Nobody seems to have a firm idea of why they chose that formula. The best guess seems to be that it's based on a rough approximation of a normal distribution -- strictly, it's a triangular distribution. A lumpy bell curve, basically, that assumes that the "likely case" falls within 1 standard deviation of the true mean estimate.

4/6ths approximates 66.7%, which approximates 68%, which approximates the area under a normal distribution within one standard deviation of the mean.

All that being said, there are two problems:

  1. It's essentially made up. There doesn't seem to be a firm basis for picking it. There's some Operational Research literature arguing for alternative distributions. In what universe are estimates normally distributed around the true outcome? I'd very much like to move there.
  2. The accuracy-improving effect of the 3-point / PERT estimation method might be more about the breaking down of tasks into subtasks than from any particular formula. Psychologists studying what they call "the planning fallacy" have found that breaking down tasks -- "unpacking", in their terminology -- consistently improves estimates by making them higher and thus reducing inaccuracy. So perhaps the magic in PERT/3-point is the unpacking, not the formulae.
Philana answered 7/3, 2014 at 3:49 Comment(2)
You are right. Why they multiplied by 4 ??? 4M means, ver likely case I think... So they are using two standard deviation ? Why exactly 4 ?Wraith
Like I said, there doesn't seem to be a firm justification for the weightings, but 4/6 approximately resembles 2/3rds, which resembles the amount of the area under a normal curve which lies within one standard deviation of the mean.Philana
G
3

Isn't it a well working thumb-number?

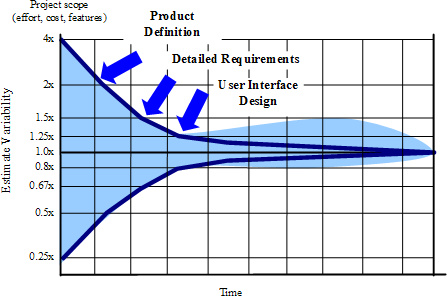
The cone of uncertainty uses the factor 4 for the beginning phase of the project.

enter image description here

The book "Software Estimation" by Steve McConnell is based around the "cone of uncertainty" model and gives many "thumb-rules". However every approximated number or a thumb-rule is based on statistics from COCOMO or similar solid researches, models or studies.

Greensboro answered 20/8, 2015 at 12:20 Comment(0)
C
1

Ideally these factors for O, M and L are derived using historical data for other projects in the same company in the same environment. In other words, the company should have 4 projects completed within M estimate, 1 within O and 1 within L. If my company/team had got 1 project completed within original O estimate, 2 projects within M and 2 within L, I would use another formula - (O + 2M + 2L) / 5. Does it make sense?

Crawl answered 7/3, 2014 at 7:39 Comment(0)
A
0

The cone of uncertainty was referenced above ... it's a well-known foundational element used in agile estimation practices.

What's the problem with it though? Doesn't it look too symmetrical - as if it's not natural, not really based on real data?

If you ever though that then you're right. The cone of uncertainty shown in the picture above is made up based on probabilities ... not actual raw data from real projects (but most of the times it's used as such).

Laurent Bossavit wrote a book and also gave a presentation where he presented his research on how that cone came to be (and other 'facts' we often believe in software engineering):

The Leprechauns of Software Engineering

https://www.amazon.com/Leprechauns-Software-Engineering-Laurent-Bossavit/dp/2954745509/

https://www.youtube.com/watch?v=0AkoddPeuxw

Is there some real data to support a cone of uncertainty? The closest he was able to find was a cone that can go up to 10x in the positive Y direction (so we can be up to 10 times off on our estimation in terms of the project taking 10 times as long in the end).

Hardly anybody estimates a project that ends up finishing 4 times earlier ... or ... gasp ... 10 times earlier.

Automobile answered 1/3, 2018 at 1:46 Comment(0)

© 2022 - 2024 — McMap. All rights reserved.