Set tracking traits of template class in boost serialization to reduce memory consumption
Asked Answered
C

1

2

As this link stated for defining traits for a template class we should define it manually or we extract our class from the trait class. But I want to make this process automatically, for this reason inspired from BOOST_CLASS_TRACKING I wrote the blow code:

#include<boost/preprocessor/tuple/enum.hpp>

...

#define FOO_CLASS_TRACKING(E, PARAMETER_TUPLE, ...)           \
  namespace boost {                                             \
  namespace serialization {                                     \
  template<BOOST_PP_TUPLE_ENUM(PARAMETER_TUPLE)>                \
  struct tracking_level< __VA_ARGS__ >                          \
  {                                                             \
    typedef mpl::integral_c_tag tag;                            \
    typedef mpl::int_< E> type;                                 \
    BOOST_STATIC_CONSTANT(                                      \
                          int,                                  \
                          value = tracking_level::type::value   \
                                             );                 \
    /* tracking for a class  */                                 \
    BOOST_STATIC_ASSERT((                                       \
                         mpl::greater<                          \
                         /* that is a prmitive */               \
                         implementation_level< __VA_ARGS__ >,   \
                         mpl::int_<primitive_type>              \
                         >::value                               \
                                             ));                \
  };                                                            \
  }}

// which used like this
FOO_CLASS_TRACKING(boost::serialization::track_never, (typename Key, typename Value), Foo<Key, Value>)

I used this macro in my code, but now I am not sure whether this macro prevent the class from tracking or not. I have a big data structure and I want to consume less memory during serialization. By checking my program using callgrind I found that most of new() call in serialization lib is from a function named save_pointer in file basic_oarchive.hpp which stores a map of pointers to track objects, I expected by changing all classes to never_track memory consumption reduces significantly. But no significant change was happened.

Does my macro have a problem? or memory consumption of serialization does not relate to tracking of objects? Is there any way to find that tracking traits of a class was set or not?

Edit:

My project in brief is a trie that each node is a pointer of an abstract class and has pointer to its children. If I do not disable tracking of pointers all these nodes save on a map of boost serialization library and memory multiplies by two during serialization.

Update:

The macro I put here works well. But for disabling tracking you must notice that there are many internal pointer that the library tracks them. For example in my case there was many pointer to pair<const Key, Value> which is the internal pointer of many stl or other containers. By disabling all of them memory consumption reduces significantly.

Chaves answered 14/2, 2016 at 12:33 Comment(0)
A
2

UPDATE

OP has since posted the synthetic benchmark that does show the thing he is trying to measure.

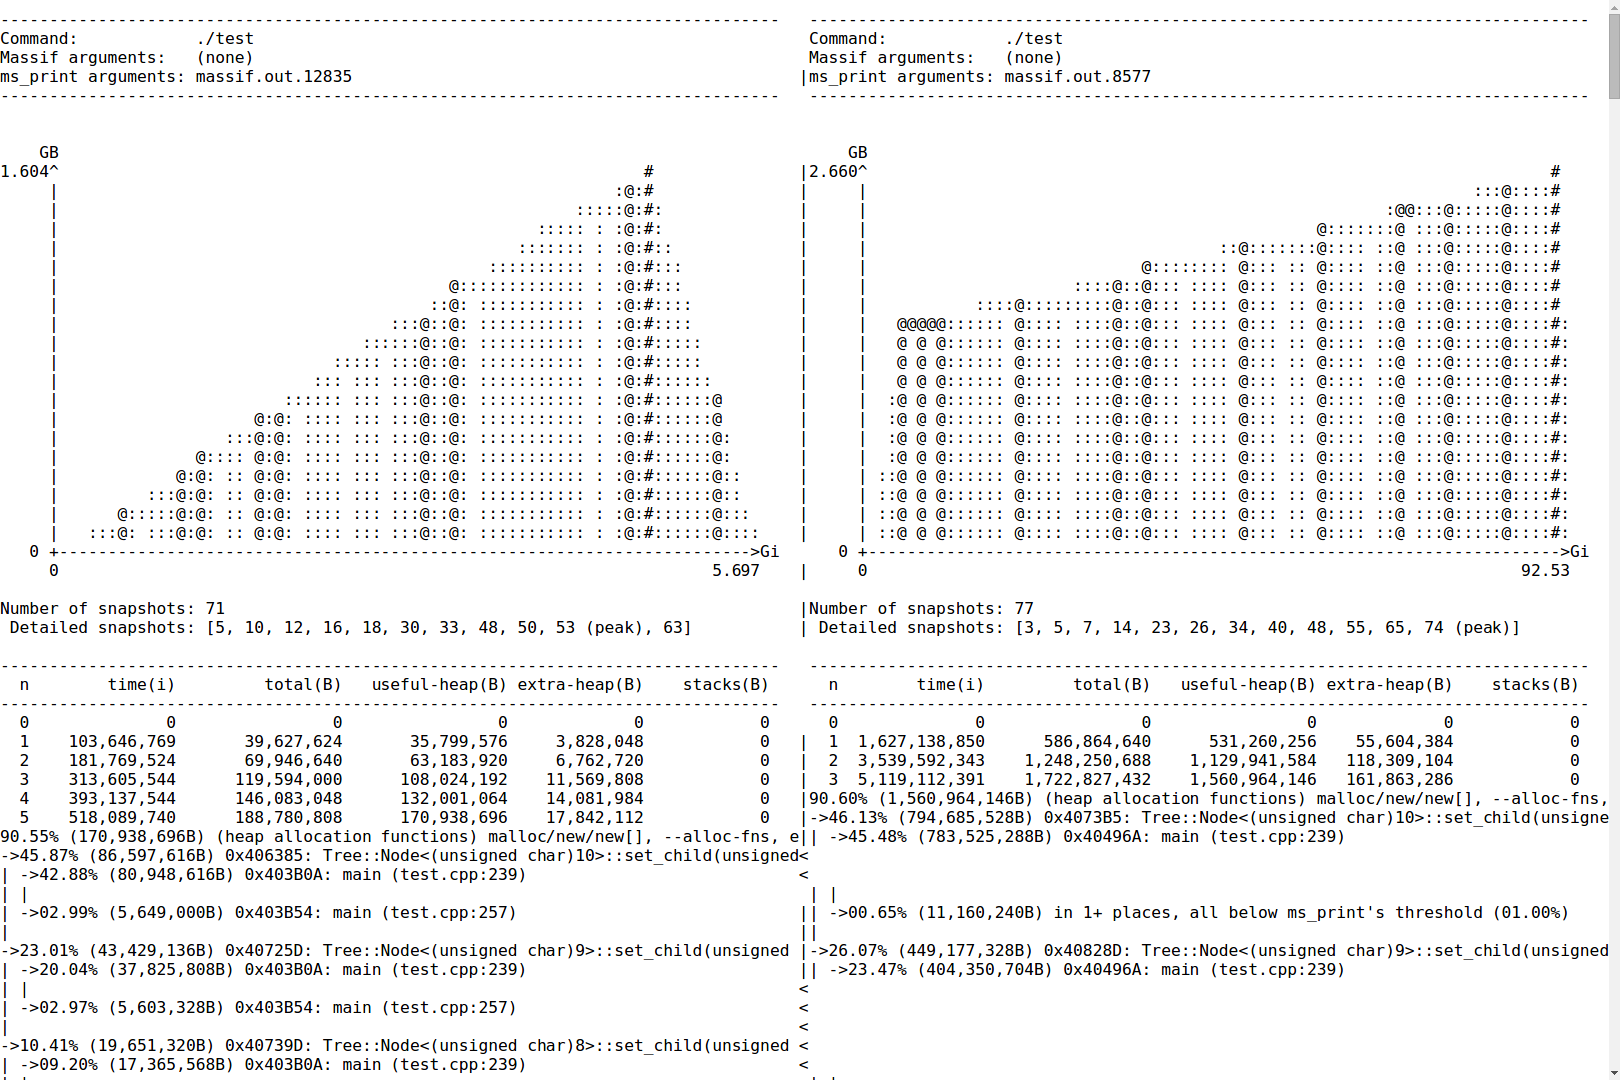
I ran it under Massif, twice: on the left just building a large Tree, and on the right also serializing it: https://gist.github.com/sehe/5f060a3daccfdff3178c#file-sbs-txt

enter image description here

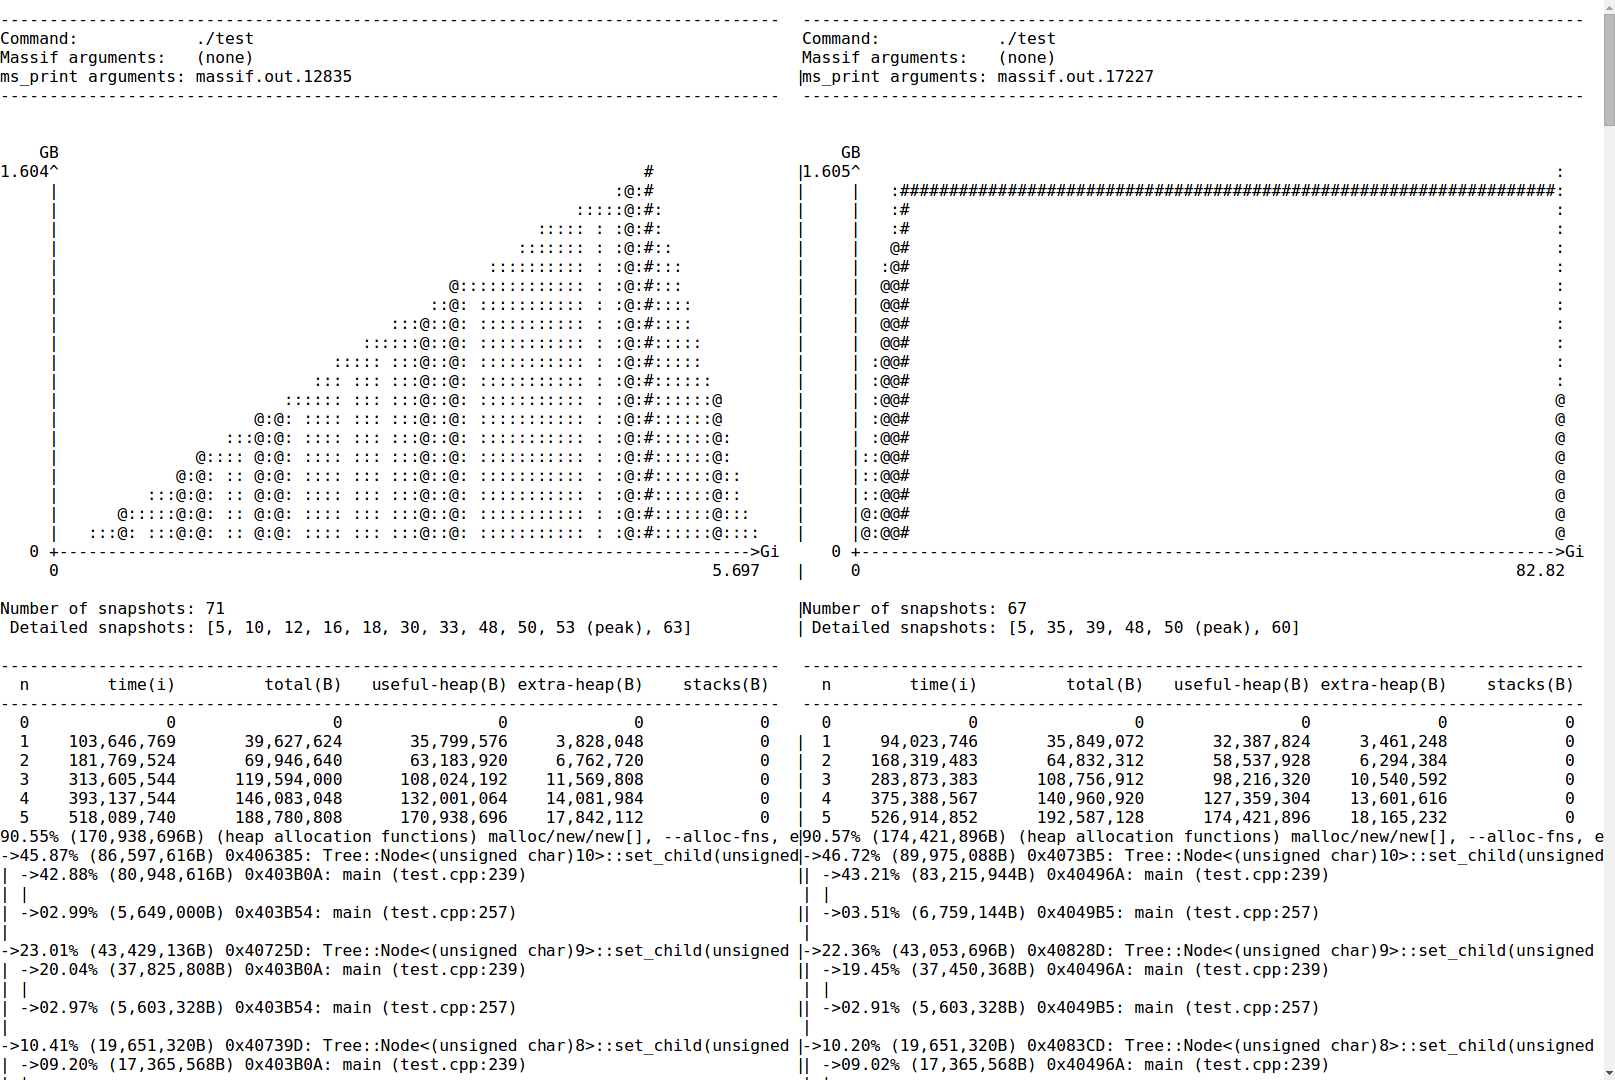
Note how memory usage is basically exactly identical: object tracking is not an issue here

For comparison, when tracking is enabled: https://gist.github.com/8d3e5dba7b124a750b9b

enter image description here

Conclusion

Q. I used this macro in my code, but now I am not sure whether this macro prevent the class from tracking or not.

Yes. It clearly does.


Original footnote from old answer:

¹ No it would not usually be double the amount of memory - that would take a very specific kind of data set with a very low payload-to-trie-node size ratio

Antilogism answered 14/2, 2016 at 13:6 Comment(14)
Please look at my edit note, this explains in brief my main project.Chaves
To answer your update. There is no alias, I serialize the children nodes from their parent node and the nodes are not anywhere but in the parent node list. So I think there is no duplication in serialization or deserialization, but I try to get a simple code that shows my case in simple.Chaves
I see. Well, yes, a SSCCE might be able to convince me of a problem. I intuit that (over)use of pointers is complicating things, when really it sounds like you need just values (guesswork)Antilogism
I tried so much to reach a simple code that shows my main problem well. But the smallest code I reached was 300 lines that is not very suitable to put here. But using this example I found that my macro works as I expected and also using disabling tracking you can reduce size significantly. In my main project I must disable tracking of all type point for example pair<const Key, Value> which is the internal pointer of some containers.Chaves
It would be nice if you could convince me of your findings. If your code shows the problem, can you tell me how exactly you observe it?Antilogism
For finding which part of code consumes memory, I used valgrind and check which part calls new, from this I got that a map inside the serialization library. So I was sure rather that the main reason of consuming memory is the tracking. But my mistake that causes I wrote this question was that I did not disable all pointer tracking. As I told I have a trie which each node has pointers to its child, first I disabled tracking of node but it is not enough. Inside nodes I had a container which holds pointers to the children, I must disable the type of pointer that the container stored too.Chaves
Massif would tell you the exact type involved. Can you use that to additionally limit tracking?Antilogism
I am not comfortable with massif and I could not find a good visualizer for it, I used callgrind and check the part that new was called. I did not get your answer, If you mean that if I am able to limit tracking for just an object not a class I am not sure and this is one of my question too. Currently I just able to disable track of a class which is very dangerous because some type like I said before pair<const Key, Value> is very general and disabling them is not reasonable. May be my next question in SO will be about disabling a certain object not a class in general.Chaves
ms_print is simple and there ismassif_visualizer which has a GUI. of course you cannot doable tracking for a certain object. (Tracking is about that). I'm very skeptic that your memory consumption observations are correct if you didn't use a memory profiler.Antilogism
At this point, I'll stop guessing until you show me the exact code we're talking about. So I can do my own measurements and talk facts.Antilogism
OK, I got your question. I just used valgrind to find which part of my program consumes memory, but for finding how much memory is used in total I have a simple script that in a period check the memory of program and in final report the usage of memory. I checked my program before and after disabling and find that memory consumption decrease significantly. Do you think that the tracking has not important role in memory consumption?Chaves
I don't think anything about your code, because I can't see it.Antilogism
I do not know a place that I could put my code there and link it here. If you can suggest me a place, I will be glad to put my code there to get your points about that.Chaves
I've rewritten the answer. I left in my foot note in which I predicted exactly this kind of test-load (and note, even now memory usage doesn't quite double)Antilogism

© 2022 - 2024 — McMap. All rights reserved.