I found lot of solution related to my issue on Python technology but couldn't find much on Oracle SQL or PL/SQL solution. So trying it on Oracle SQL with Oracle Application Express.
I have db table that has below sample stock data for 8 days. New records are inserted every day after the market closes. I have query to find the stocks that have consecutive increase/decrease in price. Now I would like to add one more column where I can see a Pattern called bullish or bearish based on the present date and previous date values.
+-------+------------+--------+-------+-------+--------+--------+
| Stock |   Cdate    |  Open  | High  |  Low  | Close  | Volume |
+-------+------------+--------+-------+-------+--------+--------+
| XYZ   | 01-01-2021 |     40 |  40.5 |  38.5 |   38.8 |  83057 |
| XYZ   | 02-01-2021 |   39.2 |  39.2 |  37.2 |   37.8 | 181814 |
| XYZ   | 03-01-2021 |     38 |  38.5 |  36.5 |     37 | 117378 |
| XYZ   | 04-01-2021 |     36 |  36.1 |  35.6 |   35.7 |  93737 |
| XYZ   | 05-01-2021 |  35.35 |  36.8 |  35.1 |   36.6 | 169106 |
| XYZ   | 06-01-2021 |   36.5 |  38.5 |  36.5 |     38 | 123179 |
| XYZ   | 07-01-2021 |   37.5 |  39.5 |  37.3 |   39.4 | 282986 |
| XYZ   | 08-01-2021 |     39 |  40.5 |  38.5 |     40 | 117437 |
|       |            |        |       |       |        |        |
| DDD   | 01-01-2021 | 135.35 | 136.8 | 135.1 |  136.6 |  16454 |
| DDD   | 02-01-2021 |  136.5 | 138.5 | 136.5 |    138 | 281461 |
| DDD   | 03-01-2021 |  137.5 | 139.5 | 137.3 |  139.4 |  77334 |
| DDD   | 04-01-2021 |    139 | 140.5 | 138.5 |    140 | 321684 |
| DDD   | 05-01-2021 |  139.7 | 139.8 | 139.3 |  139.4 | 873009 |
| DDD   | 06-01-2021 |  139.2 | 139.2 | 137.2 |  137.8 |  62522 |
| DDD   | 07-01-2021 |    138 | 138.5 | 136.5 |    137 | 114826 |
| DDD   | 08-01-2021 |  136.6 | 136.8 | 135.1 | 135.35 |  27317 |
+-------+------------+--------+-------+-------+--------+--------+
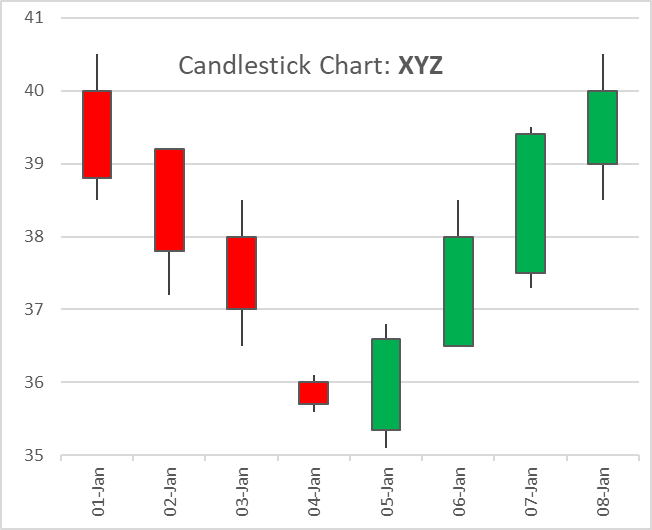
This is how the chart looks for stock XYZ:

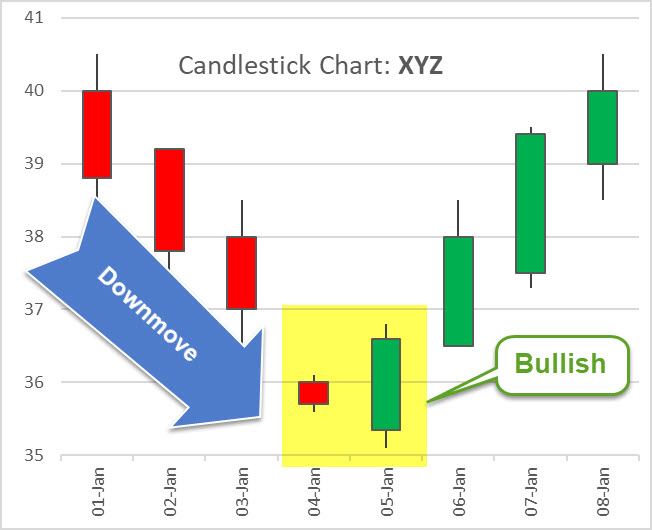
On 5th Jan 2021, the trend changed and I would like to add new column saying "Bullish" based on the formula:
O1 > C1 and C > O and C > H1 and O < L1
where,
O1 = Previous day Open price
C1 = Previous day Close price
C  = Today's Close price
O  = Today's Open price
H1 = Previous day High price
L1 = Previous day Low price
Expected output will be a new column saying "Bullish" under column Pattern:
+-------+------------+-------+------+------+-------+--------+---------+
| Stock |   Cdate    | Open  | High | Low  | Close | Volume | Pattern |
+-------+------------+-------+------+------+-------+--------+---------+
| XYZ   | 01-01-2021 |    40 | 40.5 | 38.5 |  38.8 |  83057 |         |
| XYZ   | 02-01-2021 |  39.2 | 39.2 | 37.2 |  37.8 | 181814 |         |
| XYZ   | 03-01-2021 |    38 | 38.5 | 36.5 |    37 | 117378 |         |
| XYZ   | 04-01-2021 |    36 | 36.1 | 35.6 |  35.7 |  93737 |         |
| XYZ   | 05-01-2021 | 35.35 | 36.8 | 35.1 |  36.6 | 169106 | Bullish |
| XYZ   | 06-01-2021 |  36.5 | 38.5 | 36.5 |    38 | 123179 |         |
| XYZ   | 07-01-2021 |  37.5 | 39.5 | 37.3 |  39.4 | 282986 |         |
| XYZ   | 08-01-2021 |    39 | 40.5 | 38.5 |    40 | 117437 |         |
+-------+------------+-------+------+------+-------+--------+---------+
I searched over the internet for solution and the closest I found was this. I modified the query a bit but was not able to add formula or any other new columns. Below is the query I tried:
WITH StockRow AS (SELECT stock, close, cdate,
                         ROW_NUMBER() OVER(PARTITION BY stock
                                           ORDER BY cdate) rn
                  FROM sampletable where volume > 200000),

     RunGroup AS (SELECT Base.stock, Base.cdate, base.close,
                         MAX(Restart.rn) OVER(PARTITION BY Base.stock
                                              ORDER BY Base.cdate) groupingId
                  FROM StockRow Base
                  LEFT JOIN StockRow Restart
                         ON Restart.stock = Base.stock
                            AND Restart.rn = Base.rn - 1
                            AND Restart.CLOSE < Base.CLOSE)

SELECT stock,
       COUNT(*) AS consecutiveCount,
       MIN(cdate) AS startDate, MAX(cdate) AS endDate, min(close) as latestclose
FROM RunGroup
GROUP BY stock, groupingId
HAVING COUNT(*) >= 3
and MAX(cdate) = (select max(cdate) from sampletable)
ORDER BY CONSECUTIVECOUNT desc, stock, startDate
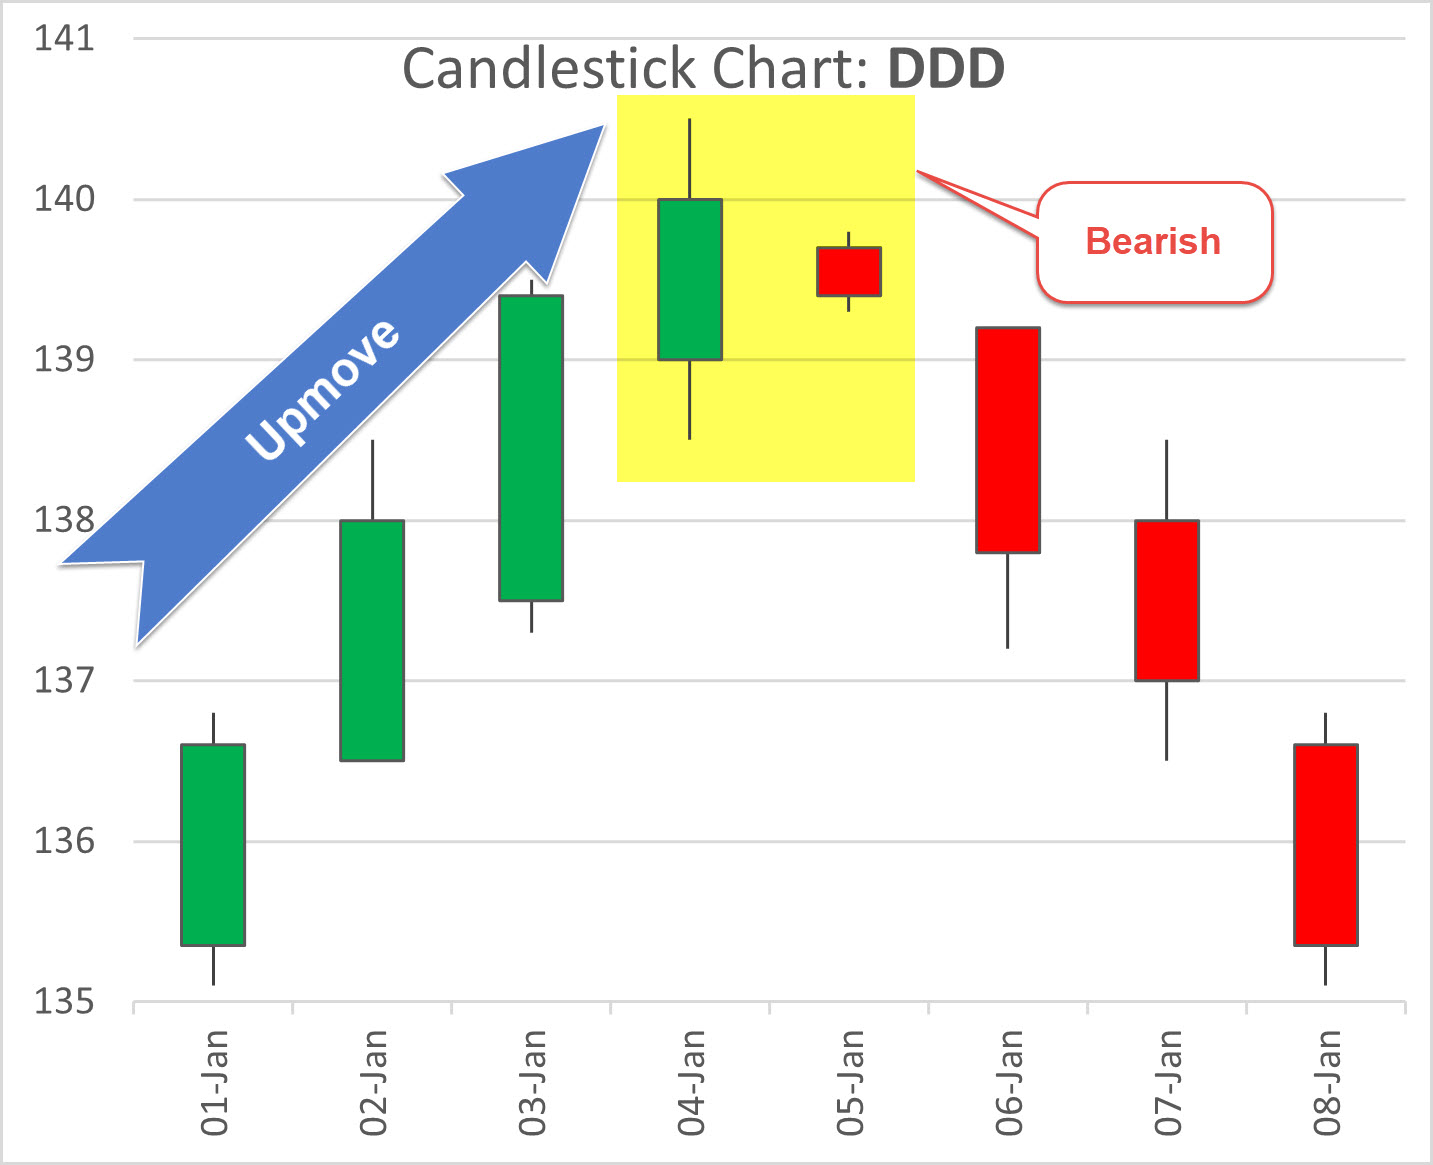
Similarly for stock, "DDD" below is how chart looks and the final data:
On 5th Jan 2021, the trend changed and I would like to add new column saying "Bearish" based on the formula:
C < O and C < C1 and O < C1 and O1 < C1 and C > O1 and O < C1
where,
O1 = Previous day Open price
C1 = Previous day Close price
C = Today's Close price
O = Today's Open price


+-------+------------+--------+-------+-------+--------+--------+---------+
| Stock |   Cdate    |  Open  | High  |  Low  | Close  | Volume | Pattern |
+-------+------------+--------+-------+-------+--------+--------+---------+
| XYZ   | 01-01-2021 |     40 |  40.5 |  38.5 |   38.8 |  83057 |         |
| XYZ   | 02-01-2021 |   39.2 |  39.2 |  37.2 |   37.8 | 181814 |         |
| XYZ   | 03-01-2021 |     38 |  38.5 |  36.5 |     37 | 117378 |         |
| XYZ   | 04-01-2021 |     36 |  36.1 |  35.6 |   35.7 |  93737 |         |
| XYZ   | 05-01-2021 |  35.35 |  36.8 |  35.1 |   36.6 | 169106 | Bullish |
| XYZ   | 06-01-2021 |   36.5 |  38.5 |  36.5 |     38 | 123179 |         |
| XYZ   | 07-01-2021 |   37.5 |  39.5 |  37.3 |   39.4 | 282986 |         |
| XYZ   | 08-01-2021 |     39 |  40.5 |  38.5 |     40 | 117437 |         |
|       |            |        |       |       |        |        |         |
| DDD   | 01-01-2021 | 135.35 | 136.8 | 135.1 |  136.6 |  16454 |         |
| DDD   | 02-01-2021 |  136.5 | 138.5 | 136.5 |    138 | 281461 |         |
| DDD   | 03-01-2021 |  137.5 | 139.5 | 137.3 |  139.4 |  77334 |         |
| DDD   | 04-01-2021 |    139 | 140.5 | 138.5 |    140 | 321684 |         |
| DDD   | 05-01-2021 |  139.7 | 139.8 | 139.3 |  139.4 | 873009 | Bearish |
| DDD   | 06-01-2021 |  139.2 | 139.2 | 137.2 |  137.8 |  62522 |         |
| DDD   | 07-01-2021 |    138 | 138.5 | 136.5 |    137 | 114826 |         |
| DDD   | 08-01-2021 |  136.6 | 136.8 | 135.1 | 135.35 |  27317 |         |
+-------+------------+--------+-------+-------+--------+--------+---------+
Appreciate any help on this.
Update: Sorry if I asking too much. This is what I am trying to achieve. In simple words, I would like to identify areas highlighted in yellow in below screenshots only if it is in upmove/uptrend or downmove/downtrend.
Stock XYZ, bullish on 05-01-2021

Stock DDD, bearish on 05-01-2021

Thanks,
Richa

