Annotating text on individual facet in ggplot2
Asked Answered
C

6

232

I want to annotate some text on last facet of the plot with the following code:

library(ggplot2)
p <- ggplot(mtcars, aes(mpg, wt)) + geom_point()
p <- p + facet_grid(. ~ cyl)
p <- p + annotate("text", label = "Test", size = 4, x = 15, y = 5)
print(p)

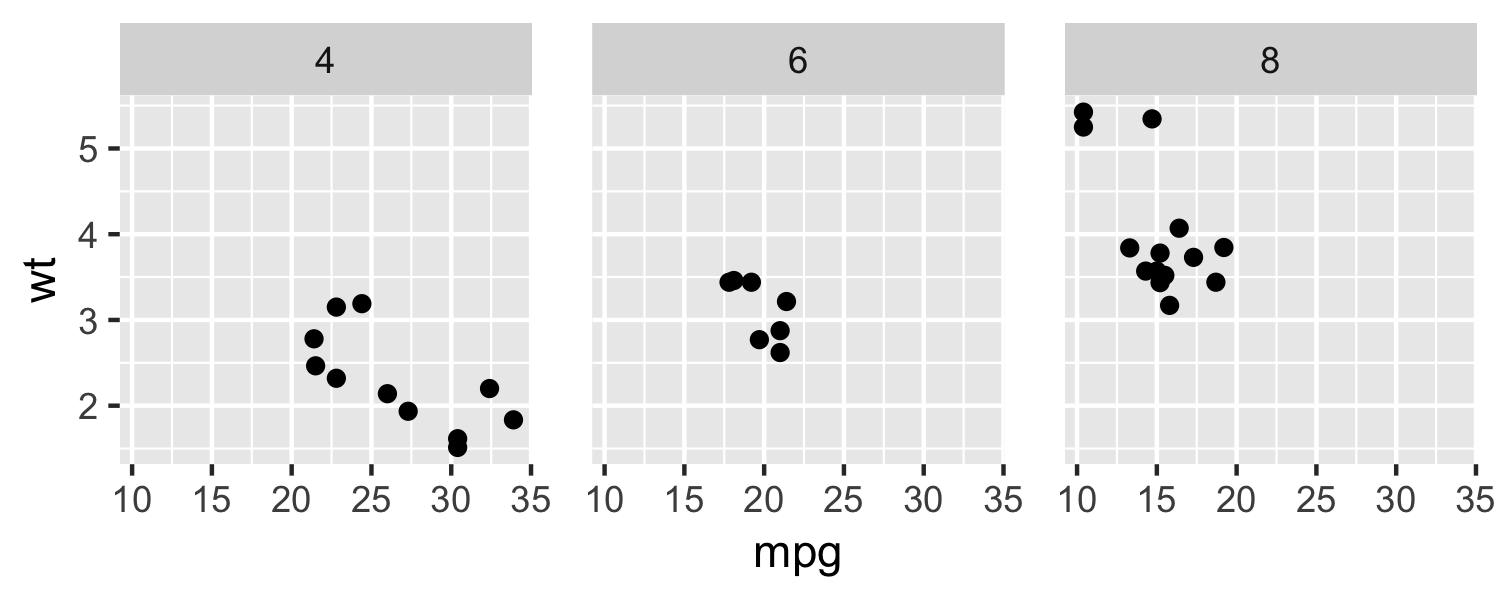
enter image description here

But this code annotates the text on every facet. How can I get the annotated text on only one facet?

Conwell answered 9/8, 2012 at 18:21 Comment(1)
I believe this is not yet implemented, so I suspect you'll have to resort to the tried and true method of constructing a data frame with the text, and a column for the faceting variable.Recto
R
205

Function annotate() adds the same label to all panels in a plot with facets. If the intention is to add different annotations to each panel, or annotations to only some panels, a geom_ has to be used instead of annotate(). To use a geom, such as geom_text() we need to assemble a data frame containing the text of the labels in one column and columns for the variables to be mapped to other aesthetics, as well as the variable(s) used for faceting.

Typically you'd do something like this:

ann_text <- data.frame(mpg = 15,wt = 5,lab = "Text",
                       cyl = factor(8,levels = c("4","6","8")))
p + geom_text(data = ann_text,label = "Text")

It should work without specifying the factor variable completely, but will probably throw some warnings:

enter image description here

Recto answered 9/8, 2012 at 18:34 Comment(10)
I seem to run into some blurry labels when I try to use geom_text() on my faceted plot. It's the same problem discussed here (groups.google.com/forum/?fromgroups=#!topic/ggplot2/evsbeBT48M4), and was resolved by using annotate("text",...). Does anyone else get blurry labels with geom_text()?Aldo
@Aldo Usually, that's because you've mistakenly told ggplot to plot a copy of each label for every row in your original data frame (the one with the points, lines, etc.). Note that that I pass a separate data frame to geom_text with only one row.Recto
Ok I got that-Thanks. What if you wanted to put 3 different labels on your faceted plot? I tried a dataframe with as many rows as I had facets, and unique labels in each row. Maybe I should start this as a separate question.Aldo
Thanks for your solution. I'm wondering if I can also do this using annotate()...?Weinberger
How can I do this if I have two levels in 'facet_wrap'?Mantel
@user3420448 The same, you just have to specify values for each faceting variable.Recto
If one wants to actually use the value in lab column, one could do geom_text(data = ann_text, aes(label = lab)) instead.Choriocarcinoma
For me this creates the character "a" in the legend of the plot. Does this happen to anybody else?Matelda
This link might be of interest: #18338153Matelda
To get rid of the character "a" in the legend, just add show.legend = FALSE to the geom, e.g.: geom_text(data = ann_text, aes(label = lab), show.legend=FALSE) @MateldaSpoonfeed
A
196

Function annotate() adds the same label to all panels in a plot with facets. If the intention is to add different annotations to each panel, or annotations to only some panels, a geometry has to be used instead of annotate(). To use a geometry, such as geom_text() we need to assemble a data frame containing the text of the labels in one column and columns for the variables to be mapped to other aesthetics, as well as the variable(s) used for faceting. This answer exemplifies this for both facet_wrap() and facet_grid().

Here's the plot without text annotations:

library(ggplot2)

p <- ggplot(mtcars, aes(mpg, wt)) +
  geom_point() +
  facet_grid(. ~ cyl) +
  theme(panel.spacing = unit(1, "lines"))
p

plot without text annotations

Let's create an additional data frame to hold the text annotations:

dat_text <- data.frame(
  label = c("4 cylinders", "6 cylinders", "8 cylinders"),
  cyl   = c(4, 6, 8)
)
p + geom_text(
  data    = dat_text,
  mapping = aes(x = -Inf, y = -Inf, label = label),
  hjust   = -0.1,
  vjust   = -1
)

plot with text annotations at edges

Alternatively, we can manually specify the position of each label:

dat_text <- data.frame(
  label = c("4 cylinders", "6 cylinders", "8 cylinders"),
  cyl   = c(4, 6, 8),
  x     = c(20, 27.5, 25),
  y     = c(4, 4, 4.5)
)

p + geom_text(
  data    = dat_text,
  mapping = aes(x = x, y = y, label = label)
)

plot with manually positioned text labels

We can also label plots across two facets:

dat_text <- data.frame(
  cyl   = c(4, 6, 8, 4, 6, 8),
  am    = c(0, 0, 0, 1, 1, 1)
)
dat_text$label <- sprintf(
  "%s, %s cylinders",
  ifelse(dat_text$am == 0, "automatic", "manual"),
  dat_text$cyl
)
p +
  facet_grid(am ~ cyl) +
  geom_text(
    size    = 5,
    data    = dat_text,
    mapping = aes(x = Inf, y = Inf, label = label),
    hjust   = 1.05,
    vjust   = 1.5
  )

facet by two variables

Notes:

  • You can use -Inf and Inf to position text at the edges of a panel.
  • You can use hjust and vjust to adjust the text justification.
  • The text label data frame dat_text should have a column that works with your facet_grid() or facet_wrap().
Apolitical answered 15/12, 2017 at 16:42 Comment(4)
This answer is superior to the accepted answer (obviously a 5-year difference between the two) for how clearly it steps through each step. Also greater clarity and explanations.Stets
If you want to add text to multiple rows, make sure that your colnames() in the text data.frame match those of the data you are about to plot.Mongolia
When I try doing this for a single one of my facets, the annotation shows up but the actual points are gone (or obscured?).Strictly
Ben G, you might consider making a new post to share your code and figure.Apolitical
S
66

If anyone is looking for an easy way to label facets for reports or publications, the egg (CRAN) package has pretty nifty tag_facet() & tag_facet_outside() functions.

library(ggplot2)

p <- ggplot(mtcars, aes(qsec, mpg)) + 
  geom_point() + 
  facet_grid(. ~ am) +
  theme_bw(base_size = 12)

# install.packages('egg', dependencies = TRUE)
library(egg)

Tag inside

Default

tag_facet(p)

Note: if you want to keep the strip text and background, try adding strip.text and strip.background back in theme or remove theme(strip.text = element_blank(), strip.background = element_blank()) from the original tag_facet() function.

tag_facet <- function(p, open = "(", close = ")", tag_pool = letters, x = -Inf, y = Inf, 
                      hjust = -0.5, vjust = 1.5, fontface = 2, family = "", ...) {

  gb <- ggplot_build(p)
  lay <- gb$layout$layout
  tags <- cbind(lay, label = paste0(open, tag_pool[lay$PANEL], close), x = x, y = y)
  p + geom_text(data = tags, aes_string(x = "x", y = "y", label = "label"), ..., hjust = hjust, 
                vjust = vjust, fontface = fontface, family = family, inherit.aes = FALSE) 
}

Align top right & use Roman numerals

tag_facet(p, x = Inf, y = Inf, 
          hjust = 1.5,
          tag_pool = as.roman(1:nlevels(factor(mtcars$am))))

Align bottom left & use capital letters

tag_facet(p, 
          x = -Inf, y = -Inf, 
          vjust = -1,
          open = "", close = ")",
          tag_pool = LETTERS)

Define your own tags

my_tag <- c("i) 4 cylinders", "ii) 6 cyls")
tag_facet(p, 
          x = -Inf, y = -Inf, 
          vjust = -1, hjust = -0.25,
          open = "", close = "",
          fontface = 4,
          size = 5,
          family = "serif",
          tag_pool = my_tag)

Tag outside

p2 <- ggplot(mtcars, aes(qsec, mpg)) + 
  geom_point() + 
  facet_grid(cyl ~ am, switch = 'y') +
  theme_bw(base_size = 12) +
  theme(strip.placement = 'outside')

tag_facet_outside(p2)

Edit: adding another alternative using the stickylabeller package

- `.n` numbers the facets numerically: `"1"`, `"2"`, `"3"`...
- `.l` numbers the facets using lowercase letters: `"a"`, `"b"`, `"c"`...
- `.L` numbers the facets using uppercase letters: `"A"`, `"B"`, `"C"`...
- `.r` numbers the facets using lowercase Roman numerals: `"i"`, `"ii"`, `"iii"`...
- `.R` numbers the facets using uppercase Roman numerals: `"I"`, `"II"`, `"III"`...

# devtools::install_github("rensa/stickylabeller")
library(stickylabeller)

ggplot(mtcars, aes(qsec, mpg)) + 
  geom_point() + 
  facet_wrap(. ~ am, 
             labeller = label_glue('({.l}) am = {am}')) +
  theme_bw(base_size = 12)

Created by the reprex package (v0.2.1)

Swordsman answered 7/9, 2018 at 7:14 Comment(7)
Source says "Adds a dummy text layer to a ggplot to label facets and sets facet strips to blank. " Ergo, if you have custom facet label strips you don't want to lose, edit the script for tag_facet by nixing strip.text = element_blank()Publias
@Publias This was actually hat I was looking for, but it does not seem to work for me: Warning: Ignoring unknown parameters: strip.textErse
To answer my issues above...this post nicely explains how to keep the strips: https://mcmap.net/q/119797/-using-facet-tags-and-strip-labels-together-in-ggplot2Erse
This is an amazing answer @Swordsman ! Super helpful!Yukoyukon
Thanks a lot @Yukoyukon :)Swordsman
@Swordsman This is a good answer to a different question, so it would deserve its own question rather than remain rather hidden here.Drury
@Tung, how can I add the minimum point of ggplot in each grid(facet)?Deduction
H
24

I think for the answer above lab="Text" is useless, the code below is also ok.

ann_text <- data.frame(mpg = 15,wt = 5,
                       cyl = factor(8,levels = c("4","6","8")))
p + geom_text(data = ann_text,label = "Text" )

However if you want to label differently in different sub-graphs, it will be ok in this way:

ann_text <- data.frame(mpg = c(14,15),wt = c(4,5),lab=c("text1","text2"),
                       cyl = factor(c(6,8),levels = c("4","6","8")))
p + geom_text(data = ann_text,aes(label =lab) )
Harijan answered 12/12, 2014 at 14:45 Comment(3)
You should explain in depth what your solution offers in comparision to the already given and accepted answer.Poleaxe
Thanks, this was useful for labeling different sub-graphs.Myasthenia
For some reason, when I do this, it adds (empty) facets for factors cyl=2 and cyl=3.Sociable
C
16

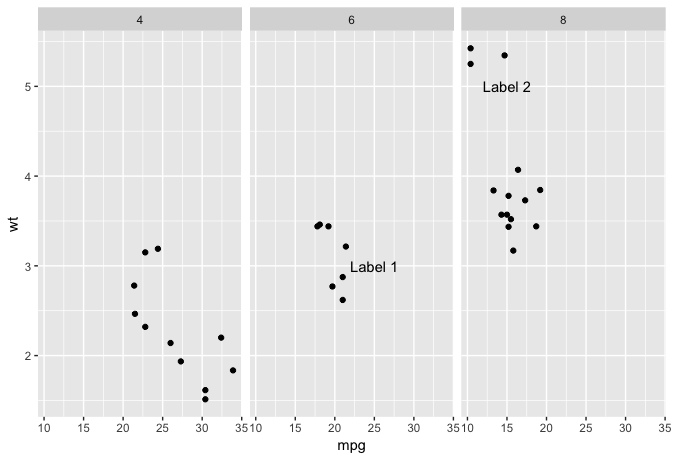
Expanding slightly on joran's excellent answer, to clarify how the label dataframe works.

You can think of "mpg" and "wt" as the x and y coordinates, respectively (I find it easier to keep track of the original variable names than renaming them, as in Kamil's also-excellent answer). You need one row per label, and the "cyl" column shows which facet each row is associated with.

ann_text<-data.frame(mpg=c(25,15),wt=c(3,5),cyl=c(6,8),label=c("Label 1","Label 2"))

ann_text
>  mpg wt cyl  label
>  25  3   6   Label 1
>  15  5   8   Label 2

p <- ggplot(mtcars, aes(mpg, wt)) + geom_point()
p <- p + facet_grid(. ~ factor(cyl))
p + geom_text(data = ann_text,label=ann_text$label)

plot with labels

Calmas answered 25/1, 2019 at 1:19 Comment(0)
T
3

I did not know about the egg package, so here is a plain ggplot2 package solution

library(tidyverse)
library(magrittr)
Data1=data.frame(A=runif(20, min = 0, max = 100), B=runif(20, min = 0, max = 250), C=runif(20, min = 0, max = 300))
Data2=data.frame(A=runif(20, min = -10, max = 50), B=runif(20, min = -5, max = 150), C=runif(20, min = 5, max = 200))
bind_cols(
Data1 %>% gather("Vars","Data_1"),
Data2 %>% gather("Vars","Data_2")
) %>% select(-Vars1) -> Data_combined
Data_combined %>%
  group_by(Vars) %>%
  summarise(r=cor(Data_1,Data_2),
            r2=r^2,
            p=(pt(abs(r),nrow(.)-2)-pt(-abs(r),nrow(.)-2))) %>%
  mutate(rlabel=paste("r:",format(r,digits=3)),
         plabel=paste("p:",format(p,digits=3))) ->
  label_df 
label_df %<>% mutate(x=60,y=190)
Data_combined %>%
  ggplot(aes(x=Data_1,y=Data_2,color=Vars)) +
  geom_point() + 
  geom_smooth(method="lm",se=FALSE) +
  geom_text(data=label_df,aes(x=x,y=y,label=rlabel),inherit.aes = FALSE) + 
  geom_text(data=label_df,aes(x=x,y=y-10,label=plabel),inherit.aes = FALSE) + 
    facet_wrap(~ Vars)
Turanian answered 30/5, 2019 at 18:4 Comment(1)
What does this solution bring to the previous ones?Orchidectomy

© 2022 - 2025 — McMap. All rights reserved.