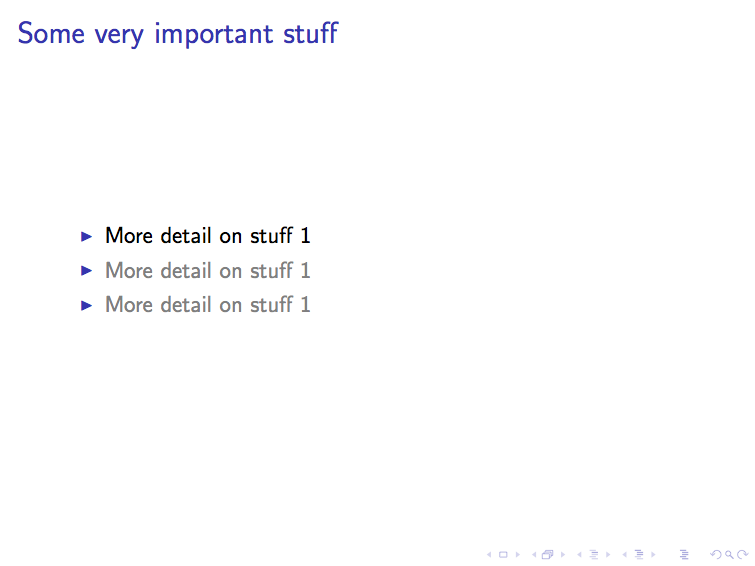
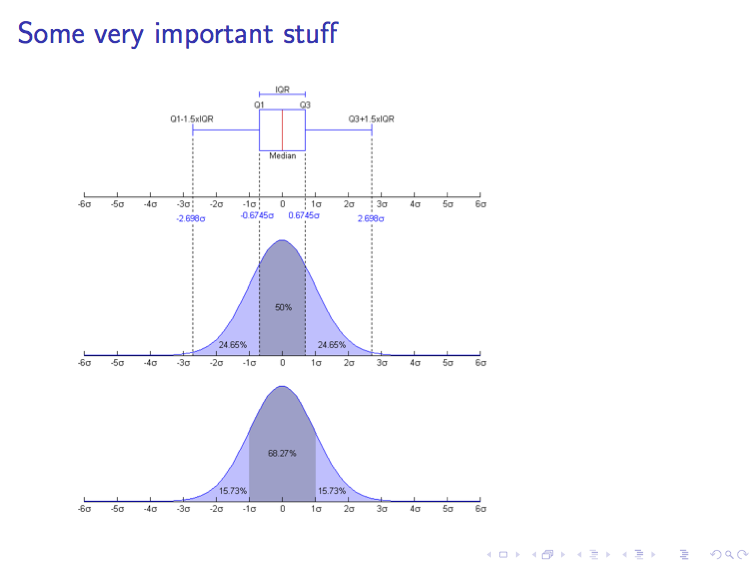
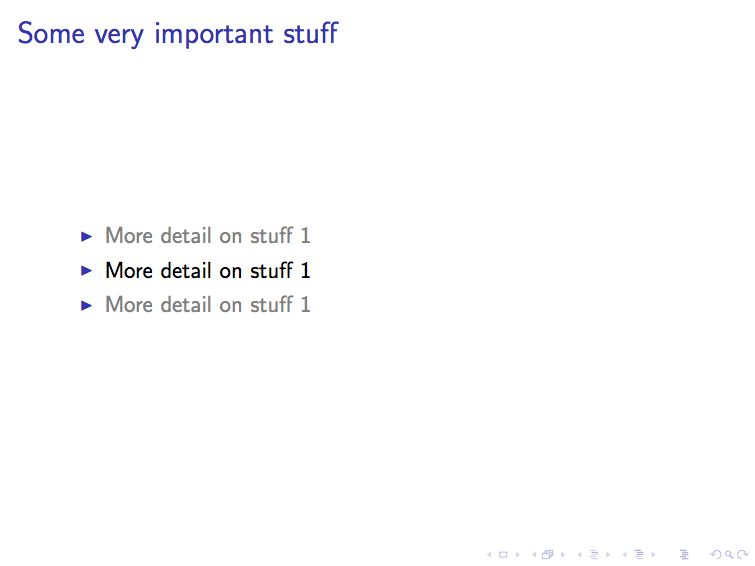
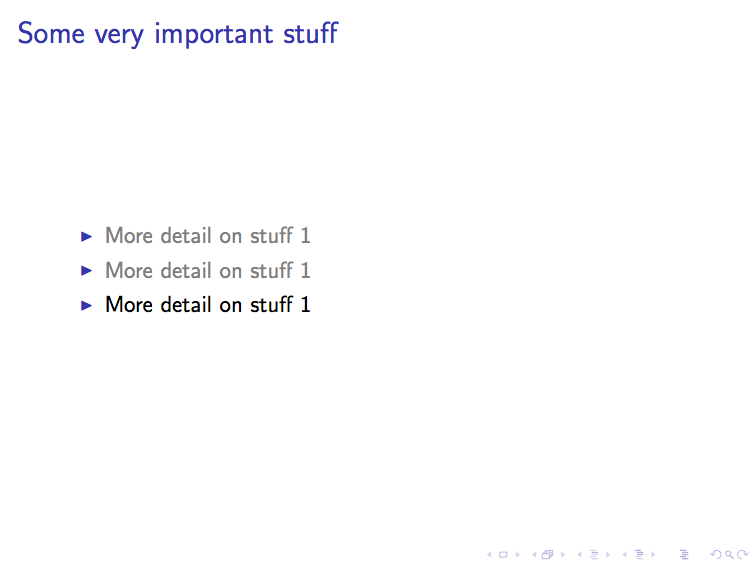
I'm really interested in interrupting incremental lists of items created in Rmarkdown with RStudio, to show plots and figures, then retake the list highlighting. This is quite straightforward in Latex, but I couldn't figure out how to achieve the same result using Rmarkdown. Below is some beamer example.
---
title: "Sample Document"
author: "Author"
output:
 beamer_presentation:
  fonttheme: structurebold
  highlight: pygments
  incremental: yes
  keep_tex: yes
  theme: AnnArbor
  toc: true
  slide_level: 3
---

# Some stuff 1
### Some very important stuff

- More detail on stuff 1
- More detail on stuff 1
- More detail on stuff 1

# The following chart should appear between the first and second item above

```{r, prompt=TRUE}
summary(iris[, "Sepal.Length"])

# Stuff 2
### There are other kinds of stuff?

```{r, prompt=TRUE}
summary(mtcars[, "cyl"])


