R tableGrob change format of row
Asked Answered
P

3

2

I have some relatively simple code to create a table for printing to a PDF:

library(gridExtra)
df <- head(iris)
tableGrob(df, gp = gpar(fontsize = 8), rows = NULL)

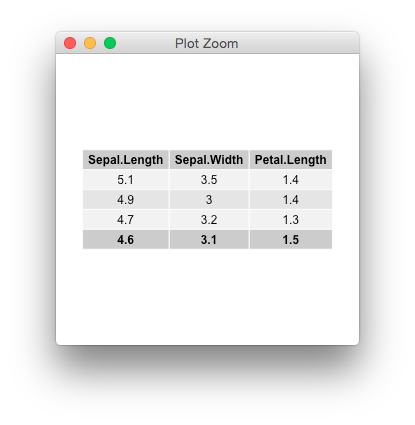
I'd like to make the last row the same format as the header row (bold, and darker gray background). I understand I can use gpar to control format of the entire table, but not sure how to just affect the last row.

Thanks!

Prophase answered 24/8, 2015 at 3:5 Comment(0)
F
3

One option is to create a new table, and merge the two together,

g1 <- tableGrob(iris[1:4, 1:3], rows=NULL)
g2 <- tableGrob(iris[1, 1:3], rows=NULL, # can't have empty content
                cols=as.character(iris[4, 1:3])) # use 4th row as header

grid.newpage()
g <- rbind(g1[-nrow(g1), ], g2[1,])
grid.draw(g)

enter image description here

Flowers answered 24/8, 2015 at 6:15 Comment(4)
I like your second solution. However, how do I convert that to a grob object, like g1?Prophase
rbind() gives you a gtableFlowers
This is a perfect elegant solution! Thanks! Works well in RStudio. However, if I have a list of such grobs, g, for some reason, this format seems to be lost when using grid.arrange. For example, myGrobs <- list(grob(g), grob(g)), then grid.arrange(grobs = myGrobs) does not seem to retain the format of grid.draw(g) in RStudio. No errors or warnings either. Is this an easy fix? Perhaps this warrants a new post.Prophase
probably best as a new question, i don't really understand what you mean by grob(g) to be honestFlowers
F
4

You could edit the grobs, as suggested in the vignette

library(gridExtra)
g <- tableGrob(iris[1:4, 1:3])

edit_cell <- function(table, row, col, name="core-fg", ...){
  l <- table$layout
  ids <- which(l$t %in% row & l$l %in% col & l$name==name)
  for (id in ids){
  newgrob <- editGrob(table$grobs[id][[1]], ...)
  table$grobs[id][[1]] <- newgrob
  }
  table
}

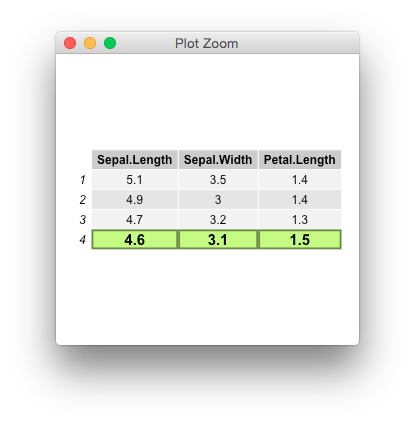
g <- edit_cell(g, nrow(g), seq_len(ncol(g)), "core-fg", 
               gp=gpar(fontsize=15, fontface="bold"))
g <- edit_cell(g, nrow(g), seq_len(ncol(g)), "core-bg", 
               gp=gpar(fill="darkolivegreen1", 
                       col = "darkolivegreen4", lwd=5))

grid.newpage()
grid.draw(g)

enter image description here

Flowers answered 24/8, 2015 at 21:45 Comment(0)
F
3

One option is to create a new table, and merge the two together,

g1 <- tableGrob(iris[1:4, 1:3], rows=NULL)
g2 <- tableGrob(iris[1, 1:3], rows=NULL, # can't have empty content
                cols=as.character(iris[4, 1:3])) # use 4th row as header

grid.newpage()
g <- rbind(g1[-nrow(g1), ], g2[1,])
grid.draw(g)

enter image description here

Flowers answered 24/8, 2015 at 6:15 Comment(4)
I like your second solution. However, how do I convert that to a grob object, like g1?Prophase
rbind() gives you a gtableFlowers
This is a perfect elegant solution! Thanks! Works well in RStudio. However, if I have a list of such grobs, g, for some reason, this format seems to be lost when using grid.arrange. For example, myGrobs <- list(grob(g), grob(g)), then grid.arrange(grobs = myGrobs) does not seem to retain the format of grid.draw(g) in RStudio. No errors or warnings either. Is this an easy fix? Perhaps this warrants a new post.Prophase
probably best as a new question, i don't really understand what you mean by grob(g) to be honestFlowers
F
1

I've just remembered that the formatting parameters get recycled (but only with a sane logic after version >=2.2.0), so you can do,

library(gridExtra)
library(grid)
t1 <- ttheme_default(core=list(
        fg_params=list(fontface=c(rep("plain", 4), "bold.italic")),
        bg_params = list(fill=c(rep(c("grey95", "grey90"),
                                    length.out=4), "#6BAED6"))
        ))

grid.newpage()
grid.table(iris[1:5, 1:3], theme=t1)

enter image description here

Flowers answered 24/8, 2015 at 21:44 Comment(0)

© 2022 - 2024 — McMap. All rights reserved.