what is the overlay line on each bar in a bar chart?
Asked Answered
D

2

3

I'm trying to learn myself with data visualization and when I'm going through the bar chart I'm stuck with the following thing.

In the graph there is a vertical black line on each bar in the bar char. What exactly signifies that overlay-ed black line. Thanks for your help

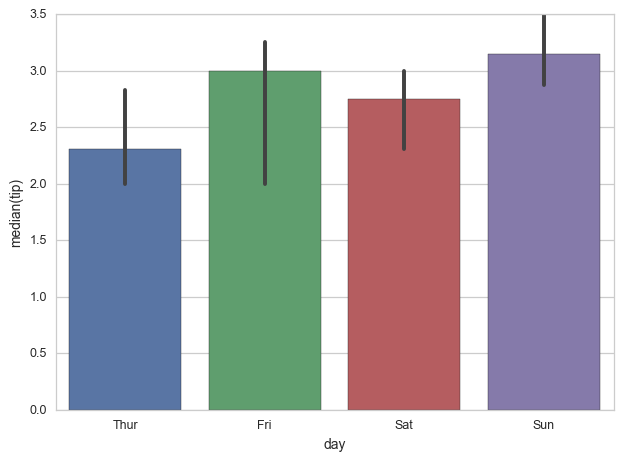
enter image description here

Dugas answered 4/2, 2016 at 6:30 Comment(0)
P
4

This looks like vertical error bars.

Error bars are a graphical representation of the variability of data and are used on graphs to indicate the error, or uncertainty in a reported measurement.

Plait answered 4/2, 2016 at 7:18 Comment(0)
P
0

I had the same questions and did some researy with a summary below. Please share your thoughts if any misunderstanding.

The error bars shows the confidence interval Or Standard Deviation.

  1. CI- a range of values that you can be x% certain contains the true mean of the population. useful link

  2. SD- require to be defined in the code.
    i.e.ax = sns.barplot(x="day", y="tip", data=tips, ci="sd") useful link

Perceptual answered 8/6, 2022 at 18:41 Comment(0)

© 2022 - 2024 — McMap. All rights reserved.