I'm using JFreeChart to create line charts that are exported as images and embedded into automatically generated documents. For instance one simple line chart would look like this:

The code I'm using to display the values would be:
LineAndShapeRenderer renderer = new LineAndShapeRenderer(true, false);
chart.getCategoryPlot().setRenderer(renderer);
renderer.setBaseItemLabelGenerator(new StandardCategoryItemLabelGenerator("{2}", NumberFormat.getNumberInstance()));
renderer.setBaseItemLabelsVisible(true);
I'd also like to add error bars to display the standard deviation of each point, this can be done by using a StatisticalLineAndShapeRenderer (and of course adding the error values to the data set), so that the chode above now becomes this:
StatisticalLineAndShapeRenderer renderer = new StatisticalLineAndShapeRenderer(true, false);
chart.getCategoryPlot().setRenderer(renderer);
renderer.setBaseItemLabelGenerator(new StandardCategoryItemLabelGenerator("{2}", NumberFormat.getNumberInstance()));
renderer.setBaseItemLabelsVisible(true);
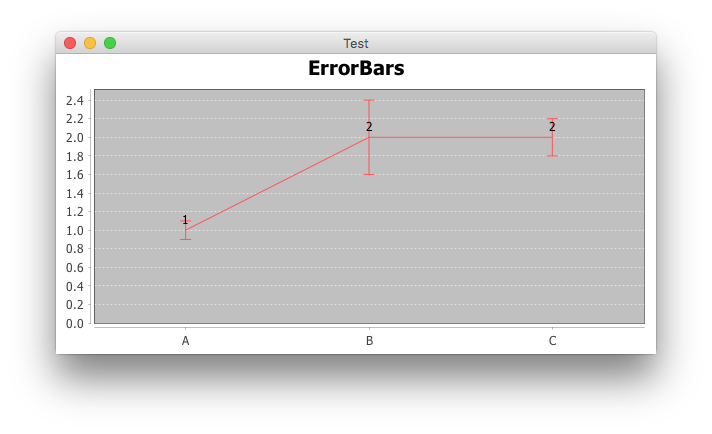
With this code the chart is generated with the error bars, but the labels have disappeared. As it can be seen in this image:

I've tried to find an online example featuring both error bars and labels but I've failed to do so. Why are the labels disappearing when using the Statustical Renderer, is there any way around this?
EDIT: Added minimal and self contained example.
DefaultStatisticalCategoryDataset dataset = new DefaultStatisticalCategoryDataset();
dataset.add(1, 0.1, "serie", "A");
dataset.add(2, 0.4, "serie", "B");
dataset.add(2, 0.2, "serie", "C");

JFreeChart chart = ChartFactory.createLineChart("Chart", null, null, dataset, PlotOrientation.VERTICAL, false, true, true);
LineAndShapeRenderer renderer = new LineAndShapeRenderer(true, false);
chart.getCategoryPlot().setRenderer(renderer);
renderer.setBaseItemLabelGenerator(new StandardCategoryItemLabelGenerator("{2}", NumberFormat.getNumberInstance()));
renderer.setBaseItemLabelsVisible(true);

JFreeChart chartErrorBars = ChartFactory.createLineChart("ErrorBars", null, null, dataset, PlotOrientation.VERTICAL, false, true, true);
StatisticalLineAndShapeRenderer statisticalRenderer = new StatisticalLineAndShapeRenderer(true, false);
chartErrorBars.getCategoryPlot().setRenderer(statisticalRenderer);
statisticalRenderer.setBaseItemLabelGenerator(new StandardCategoryItemLabelGenerator("{2}", NumberFormat.getNumberInstance()));
statisticalRenderer.setBaseItemLabelsVisible(true);

int width = 1500;
int height = 400;

try {
    FileOutputStream fos = new FileOutputStream(new File("chart.png"));
    ByteArrayOutputStream baos = new ByteArrayOutputStream();
    ChartUtilities.writeChartAsPNG(baos, chart, width, height);
    baos.writeTo(fos);
    baos.close();
    fos.close();

    fos = new FileOutputStream(new File("chartErrorBars.png"));
    baos = new ByteArrayOutputStream();
    ChartUtilities.writeChartAsPNG(baos, chartErrorBars, width, height);
    baos.writeTo(fos);
    baos.close();
    fos.close();

} catch (IOException e) {
    e.printStackTrace();
}
And the two images generated by that code.


