'Project Name' was compiled with optimization - stepping may behave oddly; variables may not be available
Asked Answered
Z

16

247

Trying to step into AFNetworking code generates following warning:

[Project Name] was compiled with optimization - stepping may behave oddly; variables may not be available.

And of course I'm not able to debug the code. To be specific I'm trying to debug UIImageView+AFNetworking category which seems impossible. Changing the code has no effect (tried NSLog, etc) and when trying to step in compilers goes to assembly code and shows UIImageView+TVASTAFNetworking as category name which does not exist anywhere in the code base.

enter image description here

Using Xcode 7. iOS 9 & 8. Cocoapods (no Framework)

UPDATE I forgot to mention that Optimizer is set to none for both release and debug configuration and I am in fact using Debug config.

enter image description here

UPDATE 2

Strip Debug Symbols Is off as well.

Zincograph answered 24/9, 2015 at 23:32 Comment(12)
I recall there being some sort of a "Strip Debug Symbols" option. That probably would cause this problem. Is it off?Blackford
@Blackford Yes Strip Debug Symbols is off.Zincograph
Weird I just tried to turn Strip Debug Symbol on, and the warning disappeared 8-|Siskind
@Zincograph Hey, did you find out how to solve the problem? I'm stuck with the same problem since updated to Xcode 7Vassily
@Hadu: Unfortunately NoZincograph
Argh! So painfully annoying, same issue here and wasted hours trying to sort it out. If I start a brand new project everything works fine :/Polygenesis
Hi! Mojtaba! Have you already solved the problem? I have the same problem, so if you've already solve this, plz let me know.Kassandra
@yomihito unfortunately no. But try answers below one might work for you.Zincograph
@Zincograph Hi, I am stuck in a similar situation and have tried everything mentioned in this thread, all in vain though. Have you found any solution ?Anabolite
@Anabolite not yet. I copied all files to a brand new project and it worked fine tho. (including pods)Zincograph
I have had a similar issue with waiting for test expectations (optimisation turned off). You should check which tests if any are hanging.Balcony
As said earlier. "There are actually two optimisation level fields under Build Settings, one for LLDB and one for Swift compiler." This did it for me, thanks.Quadriplegia
Z
10

It's been a long time but I finally solved the issue. There is a third optimization flag LTO or Link Time Optimization and Surprisingly no one have mentioned it here and for some reason I didn't pay attention to it either. It's right there above the Optimization Level setting as you can see in many screen shots posted here.

So to summarize it there are 3 different optimization flags you want to turn off for debugging :

  • LLVM Link Time Optimization (-flto)
  • LLVM Optimization Level (-O)
  • Swift Compiler Optimization Level

enter image description here

More information about LTO: http://llvm.org/docs/LinkTimeOptimization.html

Zincograph answered 11/8, 2017 at 18:54 Comment(3)
I did it. Not worked for me. I m facing this issue in ios build which is genereated by Unity.Annuitant
@Chandni, Here I faced the same problem did you find the solution?Adey
@Annuitant Have you solved the issue?Meow
D
204

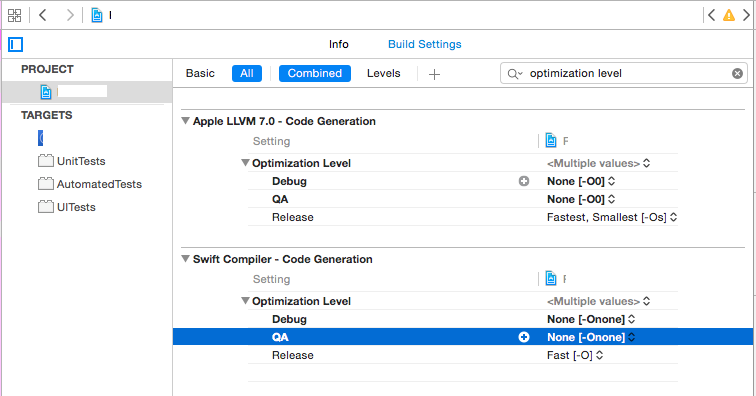
If your project is using Swift, there are two separate "Optimization Level" settings in the project/target configuration.

Make sure you set them both correctly:

  1. Select your project in the Project Navigator pane
  2. Select your project's settings under the "PROJECT" tree
  3. Click "Build Settings" tab
  4. Search for "Optimization Level" and you'll see two settings, one for LLVM and one for swift.
  5. Set the appropriate setting (None [-O0] for LLVM and None [-0none] for Swift) for the build config in question.

was compiled with optimization stepping may behave oddlyvariables may not be available

Doing this resolved that warning for me.

Deus answered 7/10, 2015 at 5:7 Comment(3)
What with mixed language projects...?Goforth
What's the difference between LLVM & Swift? Is it that Swift is what I wrote in the project and LLVM is for whatever I'm doing in regards to debugging in the debugger ie things like po , p, expr ... ?Strychnic
Thank you, I just don't understand how it changed by itself...Remove
B
142

It looks like your project is in Release mode. Release mode compiles the app with lots of optimizations, but debuggers hate optimizations, so to reliably debug the app, you need to switch it to Debug mode which reduces optimization and adds a bunch of debugging information. To switch it to Debug mode:

  • Click on your scheme in the top-left corner of Xcode.

Click on your scheme in the top-left corner of Xcode.

  • Select "Edit Scheme..."

Select "Edit Scheme..."

  • Click on the "Build Configuration" dropdown. and change it to Debug mode.

Click on the "Build Configuration" dropdown.

Blackford answered 24/9, 2015 at 23:37 Comment(2)
I am using debug. and sure optimizer is OFF.Zincograph
This was interesting. Also because I had it set to Release mode some of my breakpoints were not getting hit while some others were getting hit ¯_(ツ)_/¯Strychnic
S
68

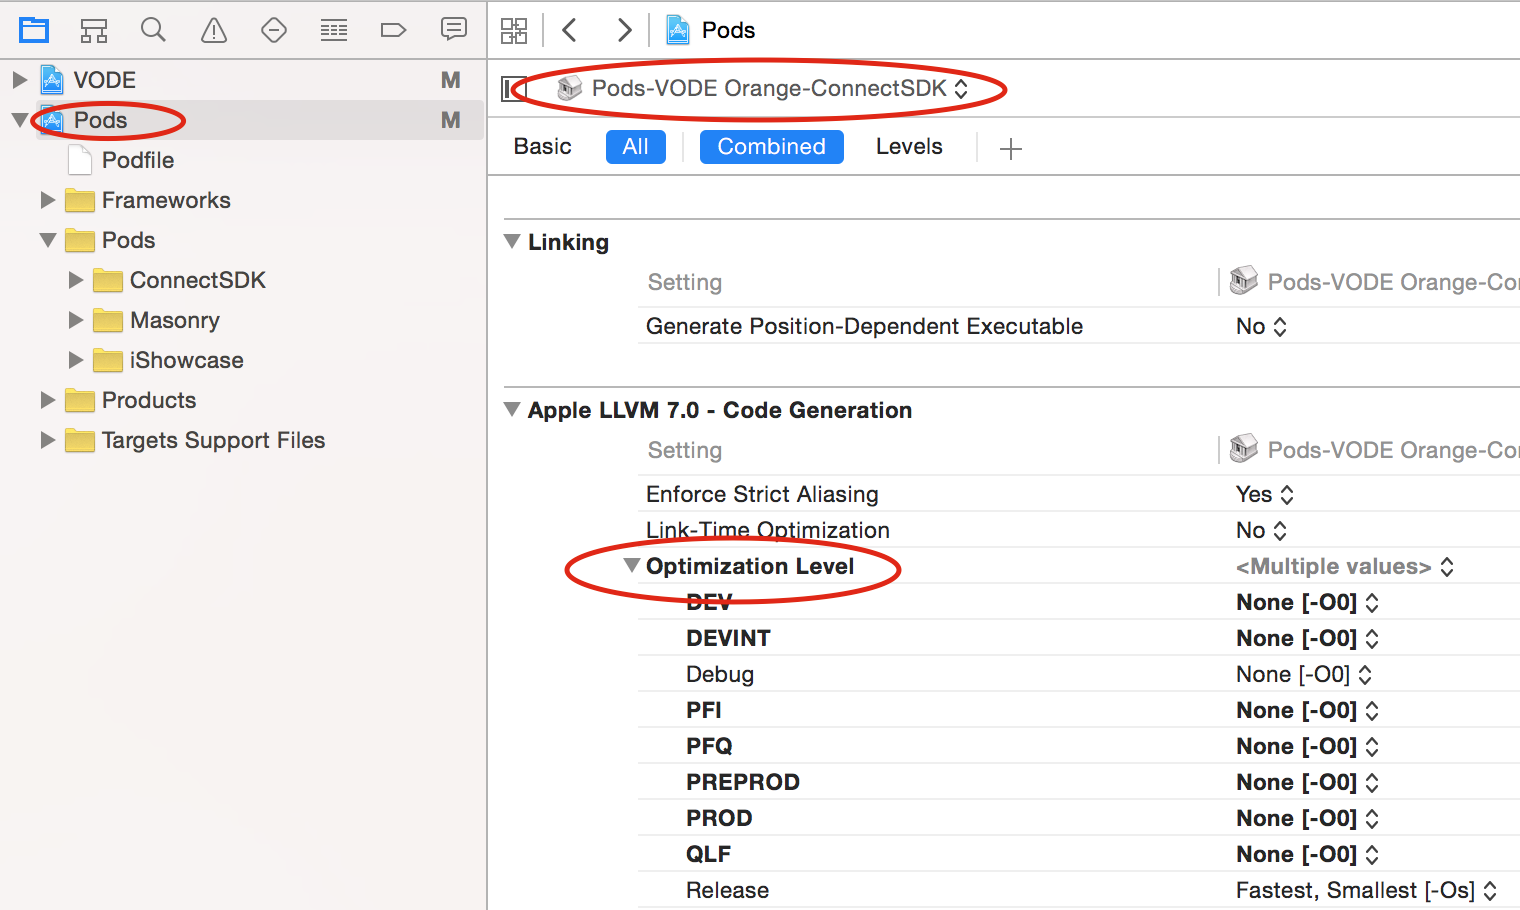
This warning only appears when you hit a breakpoint but the source is in a project has optimization enabled. This prevents you from watching real variable values (every object is shown as nil, even if it's not)

Are you using CocoaPods?

In my case, it only happened when debugging step by step through a cocoapod dependency.

So even if you have your main target and project settings correctly set (Strip Debug Symbol=OFF, and Optimization level None), you need to make sure it is the same for the Pod project your hitting the breakpoint from.

enter image description here

Siskind answered 1/10, 2015 at 16:55 Comment(6)
Read other answers, they are suggesting the same. but they are all off in my project (aka None [-O0])Zincograph
I know you said it is off in your projet, just like it was in mine, but did you take a look at your Pod dependencies projects configuration?Siskind
Same problem here with Xcode 7. Probably the problem appeared when I started using the trachkerbird library. But the breakpoint is inside my own code.Freddafreddi
For Pods project, change the "PROJECT" optimization level setting to None works. (no changes for any pod target).Duello
This is incorrect. It will get overridden when you pod install again. Change it like this.Libelee
This warning only appear when you hit a breakpoint and the source is in a project where optimization is enabled should mean that I would not be looking for a solution without any breakpoints, so I have a feeling this isn't the case.Heavyarmed
T
14

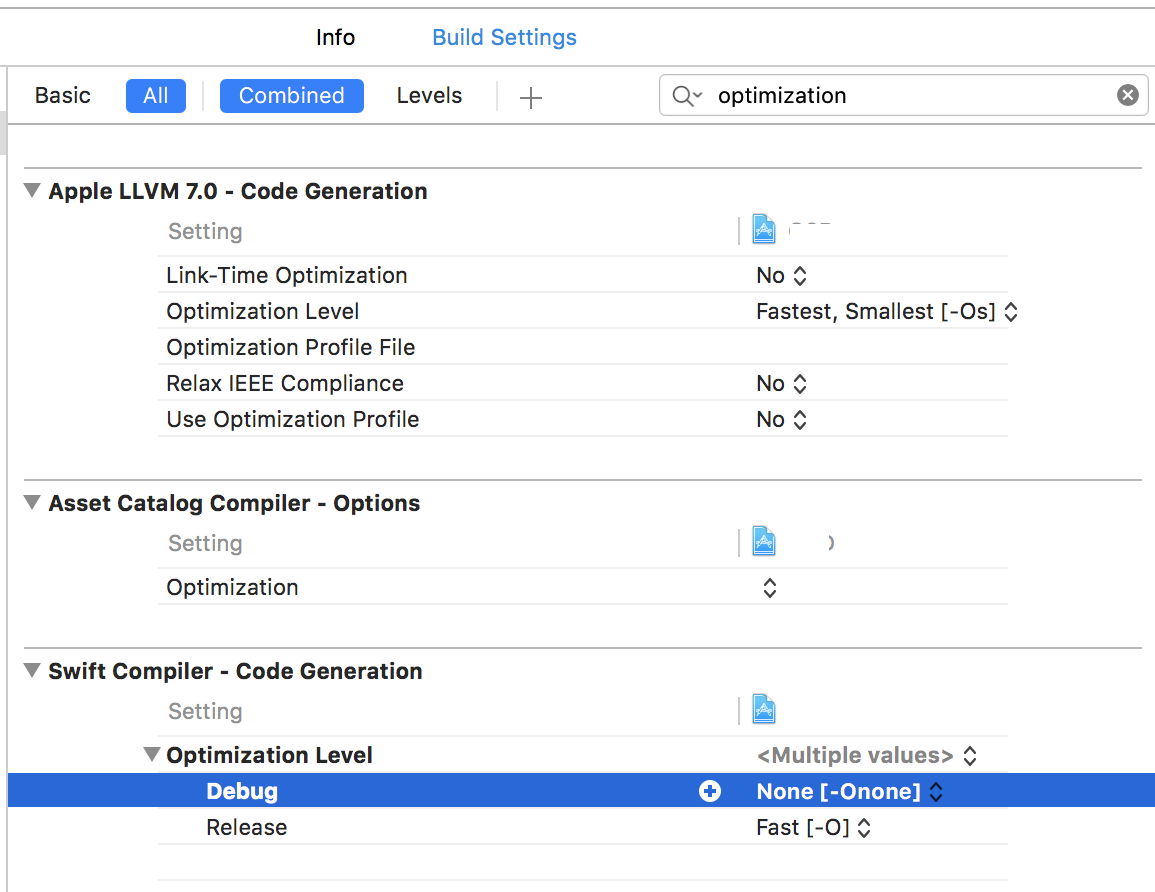
Turns out that after importing an old project (Xcode 7.x+) to new Xcode 8.3 (8E162), probably due to compiler optimization, the Swift Compiler - Optimization Level was set by default to Fast, Single-File Optimization:

Before

Changing it to none, solved the issue:

after

Tarr answered 6/4, 2017 at 6:49 Comment(1)
I did it. Not worked for me. I m facing this issue in ios build which is genereated by Unity.Annuitant
L
12

Editor -> Validate Settings then confirm all changes. Then you should get Swift Compiler Optimisation Level in place

Set Debug to None.

Lyse answered 6/11, 2015 at 8:20 Comment(1)
I did it. Not worked for me. I m facing this issue in ios build which is genereated by Unity.Annuitant
C
12

This was the solution for me...

Along the lines of gimino's answer, if you are using cocoapods, add a line like this to the Podfile:

xcodeproj 'MyProject', 'Debug - local'=>:debug, 'Debug - staging'=>:debug, 'Debug - PRODUCTION'=>:debug

or for cocoapods versions >= 1.0 (thanks Diejmon)

project 'MyProject', 'Debug - local'=>:debug, 'Debug - staging'=>:debug, 'Debug - PRODUCTION'=>:debug

Where MyProject has 'Debug - local', 'Debug - staging', 'Debug - PRODUCTION' as debug configuations in addition to the standard 'Debug'

By default, cocoapods will usually generate pod configurations as Release, this Podfile line allows you to tell it they are debug.

Cyclo answered 16/12, 2015 at 23:22 Comment(0)
T
10

I ran into the same issue today, and figured it out (at least in my case). I'm also using CocoaPods, and I was having this issue when running my test target (Swift mixed with ObjC).

I'm using Xcode 7.2, with iOS 9.2 SDK.

In the image below, you can see the optimizations for the target and project before my change:

optimization level before change

The surprising thing is that even though the resolved Optimization is None [-O0], only after changing the project setting from -Os to -O0 did the compiler stop optimizing the target.

Below you can see my final settings:

optimization level after change

Tetracycline answered 10/12, 2015 at 18:16 Comment(0)
Z
10

It's been a long time but I finally solved the issue. There is a third optimization flag LTO or Link Time Optimization and Surprisingly no one have mentioned it here and for some reason I didn't pay attention to it either. It's right there above the Optimization Level setting as you can see in many screen shots posted here.

So to summarize it there are 3 different optimization flags you want to turn off for debugging :

  • LLVM Link Time Optimization (-flto)
  • LLVM Optimization Level (-O)
  • Swift Compiler Optimization Level

enter image description here

More information about LTO: http://llvm.org/docs/LinkTimeOptimization.html

Zincograph answered 11/8, 2017 at 18:54 Comment(3)
I did it. Not worked for me. I m facing this issue in ios build which is genereated by Unity.Annuitant
@Chandni, Here I faced the same problem did you find the solution?Adey
@Annuitant Have you solved the issue?Meow
P
7

If you need to disable optimisations for your Swift pods so you can debug into them, add the following to your Podfile. This will disable the optimisations for debug builds only.

post_install do |installer|
  installer.pods_project.targets.each do |target|
    target.build_configurations.each do |config|
      if config.name == "Debug"
        config.build_settings["SWIFT_OPTIMIZATION_LEVEL"] = "-Onone"
      end
    end
  end
end
Paleogeography answered 25/11, 2019 at 15:22 Comment(0)
P
2

Are you sure your debug configuration doesn't optimize code (it shouldn't)? It looks like you've accidentally enabled optimizations for debug configuration and you should turn it off from target's settings.

Phonograph answered 24/9, 2015 at 23:35 Comment(2)
optimization is off for everything. even release build just to make sureZincograph
@Mojtba But release mode turns optimizations on!Blackford
V
1

This error happened to me twice, and in every case was a mistake in the URL parameter used to request a service. In one case the URL had some space in the port section in the other case some Optional Value wasn't being unwrapped.

So the fix was to be sure the url for the request is well formed. More information about my case, and similar reporting the same here.

Valerie answered 22/7, 2016 at 20:7 Comment(1)
Thanks for this answer. The URL was incorrect in my case as well. I did not have to change any compiler optimization settings like the other answers have suggested.Glynda
I
0

This may be an oversimplification, but are you building for Release or with optimization (which remove symbols from Swift or LLVM) too high? If so edit your scheme and switch to Debug, or edit your Build Settings for swift or LLVM optimization to None (0).

Inject answered 31/7, 2018 at 2:55 Comment(0)
R
0

Just in case someone is facing this issue while debugging a pod that uses a C library internally, there is another thing you have to change in the project settings to make it work in addition to everything else listed in the thread.

Go to Pods project settings -> Your C-using target -> Build Settings -> Apple Clang - Custom Compiler Flags -> Other C Flags and remove the -O3 flag that got there somehow.

Research answered 12/4, 2019 at 11:41 Comment(0)
V
0

In my case, I had created a new scheme for a custom configuration ("Mock") which was not using optimizations, but had overlooked the Test and Analyze contexts of the scheme, which were still using the Release configuration (I must've duplicated the Release scheme initially).

Changing these to use my custom configuration removed the runtime optimizations.

Virendra answered 19/4, 2022 at 23:24 Comment(0)
P
0

If you use cocoapods and Objc, put the following code in your Podfile, it works for my case, pay attention to choose the config.name for you debug and not change Release

post_install do |installer|
    installer.pods_project.targets.each do |target|
      target.build_configurations.each do |config|
          if config.name == 'Test'
              config.build_settings['GCC_OPTIMIZATION_LEVEL'] = 0
          end
      end
    end
end
Painting answered 6/12, 2022 at 8:57 Comment(0)
R
0

In my case, it was because we introduced Swift packages to organize code. If I tried debugging code inside a Swift package, I would see that message. The solution was to rename config schemes to use the word Development instead of Dev so Xcode could map DEBUG configuration accordingly. https://www.sobyte.net/post/2022-10/spm-in-xcode/

Rowdyish answered 3/1, 2023 at 20:2 Comment(0)

© 2022 - 2024 — McMap. All rights reserved.