Angular Application shows random 500 Server Errors with Azure App Service
Asked Answered
B

1

7

We recently (in the past two weeks) discovered a very strange behavior in one of our production apps, which ran flawlessly for the last couple of months. There wasn't a deployment in over three months, either.

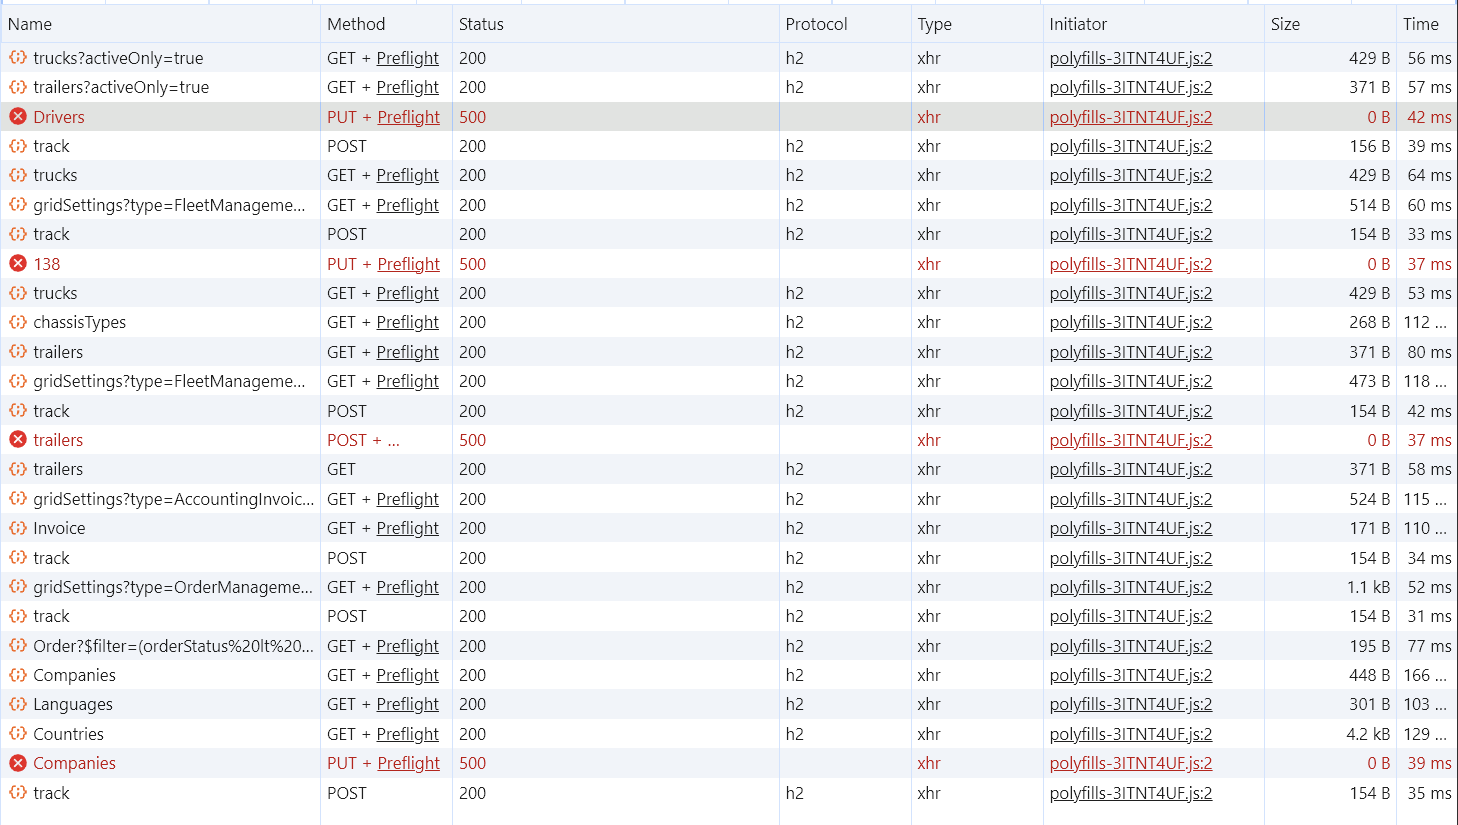
Somehow, a small portion of our user base (including some of our devs) are getting random 500 Internal Server Errors on PUT/POST requests, but none of them is visible on the backend on the server logs nor in Application insights.

Application insights itself logs those errors from the angular app with Status Code 0, which adds up to the confusion.

Interestingly, Any GET or DELETE request runs without any problem.

enter image description here

The response (body) is nonexistent, which is strange as well. enter image description here
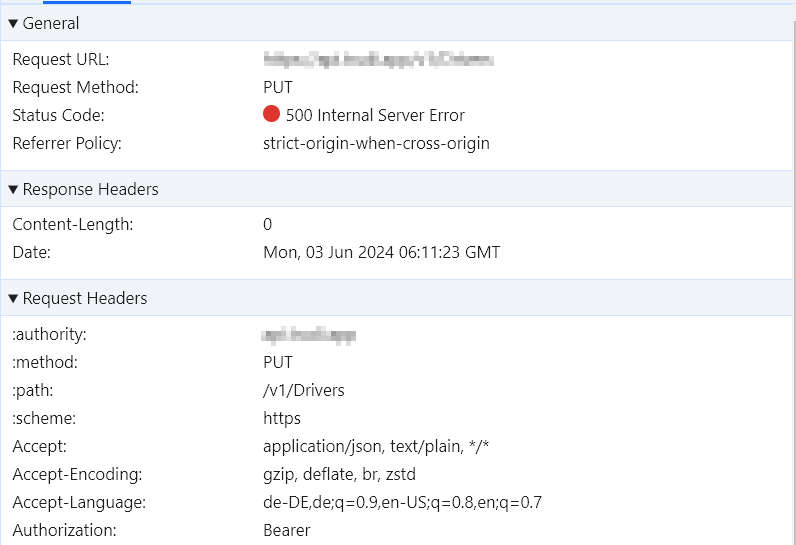
Somehow, the timing tab in the Chrome dev tools only goes to initial connection, but it appears that no request/response is really handled/shown there, what would match up with the empty response. enter image description here

That's really all from Application Insights:

enter image description here

We added some custom error logging in the Angular Application, but all the errors are undefined and definitely not coming from our API.

Some other important information:

  • Frontend: Angular 17+
  • Backend: .NET 8
  • IdentityServer for Authentication.
  • We use NSwag for the Client Generation.
  • Everything is hosted on Azure App Services on different subdomains, CORS is configured and works fine, although we see some error in the console, but we believe this is a consequence of the random 500 error with the missing response headers.
  • No Reverse Proxy or API Gateway.
  • It miraculously starts working after a couple of minutes/hours, but starts failing multiple times a day.
  • A small portion of users are affected.
  • Login/Logout doesn't solve the issue.
  • Clearing the site's cache doesn't solve the issue.
  • A second (different) browser side by side with the same user works!
  • It occurs with Chrome, Brave, Edge and Mobile Safari.
  • We saw a big spike in Application Insights for this error in the last two weeks, without any changes or deployments.

Are there any known issues with this constellation? We are running out of ideas at this point.

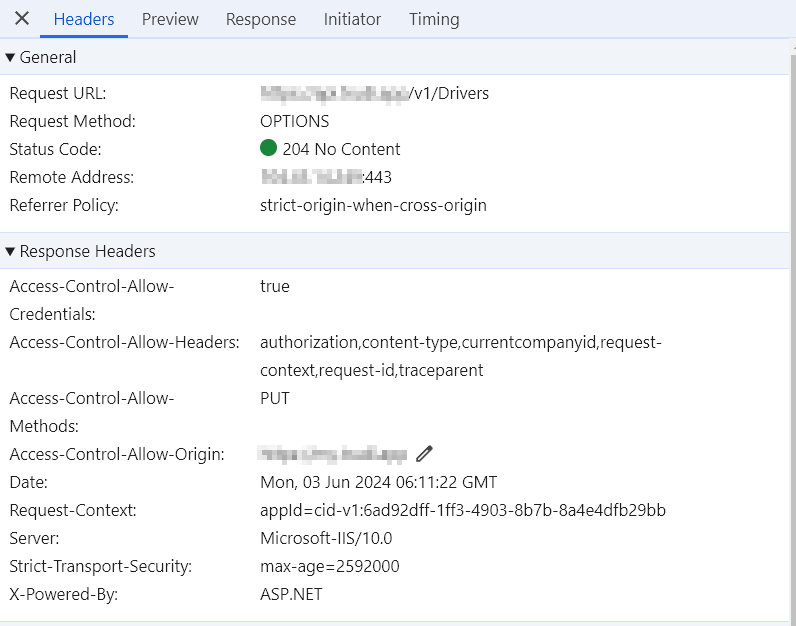
The individual OPTIONS requests are successful: enter image description here
EDIT: The very same request that fails from Angular works (Dev Tools → Copy → Fetch) in the same tabs browser console.

EDIT II: On Safari on Mac no Http Status is shown at all! enter image description here

Brundisium answered 3/6 at 6:33 Comment(10)
I can only try to push you into the right direction as from my perspective this is a server issue. Not an Angular issue. 1. As I see you use PREFLIGHT calls. This means that before the actual PUT request is send, there is an OPTIONS request. Maybe the OPTIONS request is not handled properly by your backend? Could be that your logger doesn't log such requests? 2. In the request I see the referer policy has strict-origin-when-cross-origin (which is the default with e.g. Chrome). Maybe you have a cross origin problem which marks the request as "not secure (enough)" to go through.Snakeroot
I have added the OPTIONS requests and those are always successful. Have you any idea why CORS would randomly make such problems for some users and start working again after a while? The latest release of this app was over three months ago and until two weeks ago everything worked fine.Brundisium
I have no idea. There are too many variables which could play into this. I would recommend avoiding CORS by using a simple reverse proxy and have both (backend and frontend) on the same domain.Snakeroot
This sounds pretty much like your problem. Maybe that helps? https://mcmap.net/q/1174037/-random-500-errors-on-iisSnakeroot
@Snakeroot we looked deeply into the Detailed Errors and Failed Request logs, even the eventlog of the API, but none of those errors or the requests are logged. As I said in the beginning, we believe that those requests never reached the server, but we have no clue why that's the case. What's interesting is, that around 5–10 minutes after the first failed requests, everything starts working again.Brundisium
When this happens: Is it reproducible with postman? Or is it then related to the specific browser (and even tab?).Snakeroot
It works with PowerShell (copying the failed request from the DevTools) or even with a second different browser side by side, but not with a second tab, tough. Disabling any Ad/Tracking Blocker made no difference. We have seen this behavior in Chrome (125), Edge, Brave and mobile iOS.Brundisium
I have gotten reports of something very similar to this in our app for the past few weeks. React.js, no CORS, Node.js/Express on App Service for Linux. Nothing logged on the server side, PUTs and POSTs become 500s in the browser. Switching browser or even restarting the same browser has fixed the problem. I would really like to see access logs from the load balancer but I don't think that's possible.Uropygium
@Uropygium now that's interesting. Our app runs on Windows app services, so the only common ground would be the load balancer from azure itself. Have you found out anything else?Brundisium
@Brundisium we are also affected by this, looking more and more like a MS app service problem. Exactly as you described - only POSTs (I've not noticed it's PUTs too as we don't use it that much) Our issue: #78580758Tarnation
S
4

I am getting an error from Microsoft Azure's side which is affecting app services all over. For many (us included) the issue goes away if you set your app service to use http1.1 instead of http2 in your app service configuration.

The issue has been escalated within Microsoft and they are indicating that they are working on fix. You will find this link useful: https://learn.microsoft.com/en-us/answers/questions/1687258/our-azure-app-service-application-started-to-exper?comment=question

Steep answered 5/6 at 15:22 Comment(4)
I can confirm this got it working again for usTarnation
Have you folks any long-time experience with this fix? Some have reported that the error returned after a couple of hours after switching to http 1.1.Brundisium
It's been working for us since Sunday.Steep
@Brundisium I had noticed that my browser didn't instantly switch to http1.1 after I'd made the change at the backend. Opening a new incognito window did use http 1.1, but any existing sessions kept using h2. Hopefully by now the browsers will ACTUALLY be calling http 1.1 for you and you should see the work around being a bit more successful?Tarnation

© 2022 - 2024 — McMap. All rights reserved.