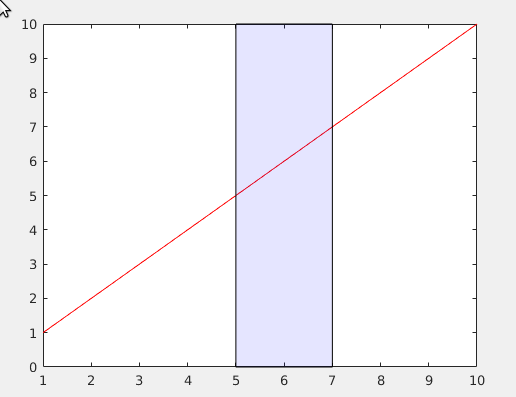
I'm sure this is a simple question, but I can't seem to figure it out. I've got this plot

and I want to add vertical lines and shade the area in between to highlight areas of the data. I feel like I should be able to do this using the area function, but can't seem to figure it out. The dates and values are all doubles and are two separate vectors, if that makes a difference. Any help would be greatly appreciated.


