How to specify time locator's start-ticking timestamp
Asked Answered
D

2

9

All I want is quite straight forward, I just want the locator ticks to start at a specified timestamp:
peudo code: locator.set_start_ticking_at( datetime_dummy )
I have no luck finding anything so far.

Here is the portion of the code for this question:

    axes[0].set_xlim(datetime_dummy) # datetime_dummy = '2015-12-25 05:34:00'
    import matplotlib.dates as matdates
    seclocator = matdates.SecondLocator(interval=20) 
    minlocator = matdates.MinuteLocator(interval=1) 
    hourlocator = matdates.HourLocator(interval=12)

    seclocator.MAXTICKS  = 40000
    minlocator.MAXTICKS  = 40000
    hourlocator.MAXTICKS  = 40000

    majorFmt = matdates.DateFormatter('%Y-%m-%d, %H:%M:%S')  
    minorFmt = matdates.DateFormatter('%H:%M:%S')  

    axes[0].xaxis.set_major_locator(minlocator)
    axes[0].xaxis.set_major_formatter(majorFmt)
    plt.setp(axes[0].xaxis.get_majorticklabels(), rotation=90 )

    axes[0].xaxis.set_minor_locator(seclocator)
    axes[0].xaxis.set_minor_formatter(minorFmt)
    plt.setp(axes[0].xaxis.get_minorticklabels(), rotation=90 )

    # other codes
    # save fig as a picture

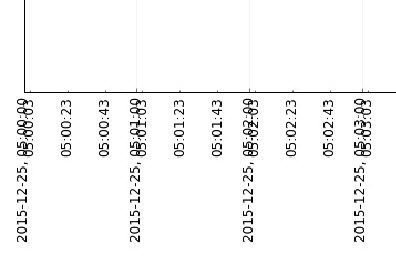
The x axis ticks of above code will get me:

enter image description here

How do I tell the minor locator to align with the major locator?
How do I tell the locators which timestamp to start ticking at?

what I have tried:
set_xlim doesn't do the trick
seclocator.tick_values(datetime_dummy, datetime_dummy1) doesn't do anything

Disorganization answered 13/5, 2016 at 21:33 Comment(0)
H
14

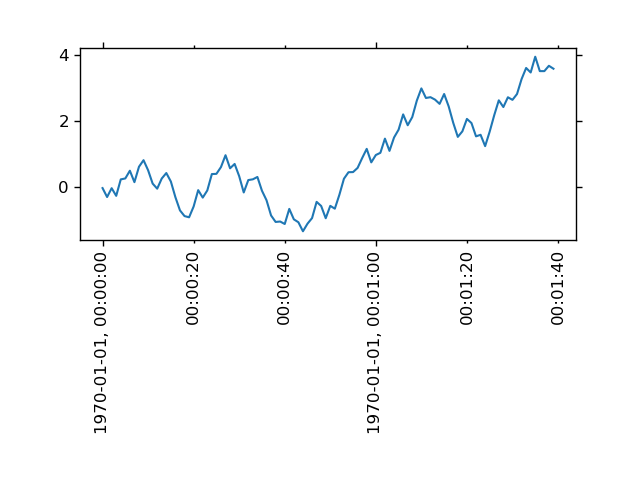
Instead of using the interval keyword parameter, use bysecond and byminute to specify exactly which seconds and minutes you with to mark. The bysecond and byminute parameters are used to construct a dateutil rrule. The rrule generates datetimes which match certain specified patterns (or, one might say, "rules").

For example, bysecond=[20, 40] limits the datetimes to those whose seconds equal 20 or 40. Thus, below, the minor tick marks only appear for datetimes whose soconds equal 20 or 40.

import numpy as np
import matplotlib.pyplot as plt
import matplotlib.dates as matdates

N = 100

fig, ax = plt.subplots()
x = np.arange(N).astype('<i8').view('M8[s]').tolist()
y = (np.random.random(N)-0.5).cumsum()
ax.plot(x, y)


seclocator = matdates.SecondLocator(bysecond=[20, 40]) 
minlocator = matdates.MinuteLocator(byminute=range(60))  # range(60) is the default

seclocator.MAXTICKS  = 40000
minlocator.MAXTICKS  = 40000

majorFmt = matdates.DateFormatter('%Y-%m-%d, %H:%M:%S')  
minorFmt = matdates.DateFormatter('%H:%M:%S')  

ax.xaxis.set_major_locator(minlocator)
ax.xaxis.set_major_formatter(majorFmt)
plt.setp(ax.xaxis.get_majorticklabels(), rotation=90)

ax.xaxis.set_minor_locator(seclocator)
ax.xaxis.set_minor_formatter(minorFmt)
plt.setp(ax.xaxis.get_minorticklabels(), rotation=90)

plt.subplots_adjust(bottom=0.5)
plt.show()

enter image description here

Howling answered 13/5, 2016 at 22:4 Comment(1)
Thank you thank you! Could you add a more detailed explanation how bysecond=list works in your answer? I think I disregarded this parameter while reading the documentation because I did not understand what it did. ThanksDisorganization
A
2

@unutbu: Many thanks: I've been looking everywhere for the answer to a related problem!

@eliu: I've adapted unutbu's excellent answer to demonstrate how you can define lists (to create different 'dateutil' rules) which give you complete control over which x-ticks are displayed. Try un-commenting each example below in turn and play around with the values to see the effect. Hope this helps.

import pandas as pd
import numpy as np
import matplotlib.pyplot as plt
import matplotlib.dates as mdates

idx = pd.date_range('2017-01-01 05:03', '2017-01-01 18:03', freq = 'min')
df = pd.Series(np.random.randn(len(idx)),  index = idx)
fig, ax = plt.subplots()

# Choose which major hour ticks are displayed by creating a 'dateutil' rule e.g.:

# Only use the hours in an explicit list:
# hourlocator = mdates.HourLocator(byhour=[6,12,8])

# Use the hours in a range defined by: Start, Stop, Step:
# hourlocator = mdates.HourLocator(byhour=range(8,15,2))

# Use every 3rd hour:
# hourlocator = mdates.HourLocator(interval = 3)

# Set the format of the major x-ticks:
majorFmt = mdates.DateFormatter('%H:%M')  

ax.xaxis.set_major_locator(hourlocator)
ax.xaxis.set_major_formatter(majorFmt)

#... and ditto to set minor_locators and minor_formatters for minor x-ticks if needed as well)

ax.plot(df.index, df.values, color = 'black', linewidth = 0.4)

fig.autofmt_xdate() # optional: makes 30 deg tilt on tick labels

plt.show()
Aubervilliers answered 16/8, 2018 at 19:58 Comment(0)

© 2022 - 2024 — McMap. All rights reserved.