A human-readable textual representation of a Directed Acycling Graph
Asked Answered
E

5

9

There are a bunch of both human- and machine-readable textual representations for a tree -- e.g. a nested list (in various representations -- e.g. JSON and YAML) and XML. Combined with indentation, they make it really easy to imagine the resulting structure.

But I don't see anything of the same level of readability for a Directed Acyclic Graph. It's a more general data structure than a tree so the above formats can't be used (verbatim, anyway).

  • All human-readable representations that I've ever seen were graphical
  • The raw textual representation would be to list all nodes and their connections -- which makes it hard to imagine the graph if there are more than a few nodes

The application I have in mind would be all sorts of flowcharts -- which e.g. naturally emerge in all sorts of planning tasks.


To limit the scope of the question, I'm primarily asking for standard solutions, or at least production-ready and proven to work in some areas of practice. If there are none, any experimental propositions that passed some sort of peer review (e.g. proposed in a published scientific paper) will have to do.

Energetics answered 13/9, 2019 at 15:49 Comment(11)
The only answer I see is the one you ruled out, The raw textual representation would be to list all nodes and their connectionsMaculation
@GuyCoder Well, maybe someone came up with a way to combine that raw data into some more readable form. E.g. XML/YAML entities could be used to interlink subtrees -- but I don't know if this is actually used anywhere.Energetics
Have you seen graphviz? It's graph definition is literally a list of all nodes and their connections (represented as attributes of the nodes) and in a way it is very readable. The syntax is a bit like pseudocode for SQL table definitions. Heck, in fact SQL table definitions is a textual representation of a graph (connections are foreign key constraints)Surface
@Surface no, I haven't. Could you give an answer with an example?Energetics
@GuyCoder ~10-15 nodes with 1-4 edges each without a significant readability deterioration would be adequate for my use case. I cannot find anything at all, so it's extremely unlikely that something shows up that also meets such a ridiculously high standard. Dunno about you, I don't want to be left with no answers at all.Energetics
The only other diagram I like that might work and can be converted to text would be Visibility Representations. See: Planar Orthogonal and Polyline Drawing Algorithms Section: 7.2.3 Visibility RepresentationsMaculation
Questions asking us to recommend or find a book, tool, software library, tutorial or other off-site resource are off-topic for Stack Overflow.To
Now that there are a few answers, you should create an adjacency list of what you would like to see done it each answer so that you are comparing apples to apples.Maculation
Agree with @GuyCoder, some test cases for comparison would be good.Nusku
@Nusku I've no idea what "test cases" you're talking about. I'm looking at how good a suggestion is at the stated use case of describing and representing flowcharts.Energetics
I guess by "test cases" I mean some example DAGs so each answer can show what the representation would be in an apples-to-apples way.Nusku
E
4

I'm going to go with a YAML nested list with anchors. (Which is equivalent to XML with entities but the latter has more noise.)
(I was already considering it but was wondering if anything better has been invented. Looks like it hasn't. But most importantly, @Patrick87 formally showed that it's an adequate representation.)

It's equivalent to the formal regular expression representation suggested by @Patrick87 if I replace composition with indent and union with no indent; and the anchors allow to eliminate the duplication of a subgraph under a node when it's referenced multiple times.


E.g. @GuyCoder's example

A->B
A->C
A->D
B->E
B->F
C->E
C->G
D->F
D->G
E->H
F->H
G->H

that corresponds to A(B(E+F)+C(E+G)+D(F+G))HA(B(EH+FH)+C(EH+GH)+D(FH+GH))

would be

- A
    - B
        - &E E
            - &H H
        - &F F
            - *H
    - C
        - *E
        - &G G
            - *H
    - D
        - *F
        - *G
        

(For uniformity, every original node could be made an anchor if e.g. generating it.)


It doesn't matter if the graph is planar or not because any cross-cutting links are simply not "drawn".

As a bonus, it allows to specify the data attached to each node, as a hash table rooted at the node. (Though past a certain size, it'll probably be more clear to place the data separately.)

Energetics answered 23/9, 2019 at 16:28 Comment(0)
S
6

One good textual representation of graphs is the dot language from graphviz. The syntax is easily readable description of relationships.

Note that the core idea behind graphviz is not to start with a graph and describe it but to not know what the graph looks like and start with what you know then let graphviz generate the graph for you. Due to this design goal graphviz does not have any feature for manually placing nodes - it will automatically draw nodes based on the algorithm you select.

Here's an example of what working with graphviz is like:

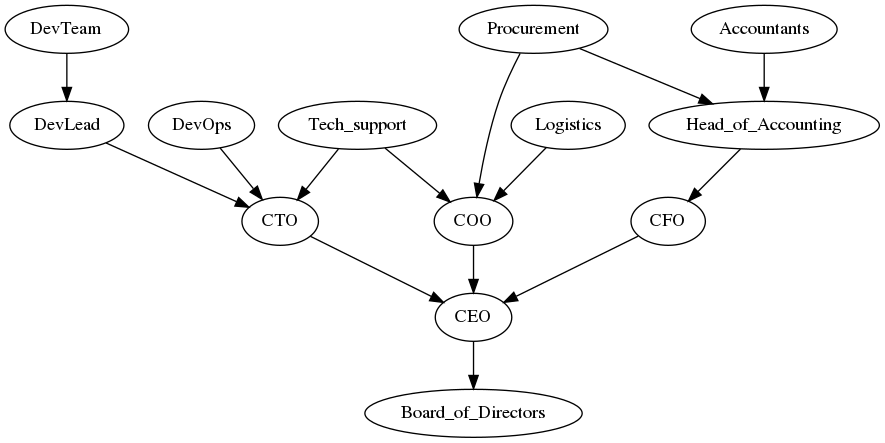
Assume you want to draw an org chart of a company. You don't know what the graphs look like yet but you know who reports to who. You can describe the company as follows:

digraph {
    CEO                ->  Board_of_Directors
    CTO                ->  CEO
    CFO                ->  CEO
    COO                ->  CEO
    DevLead            ->  CTO
    DevTeam            ->  DevLead
    DevOps             ->  CTO
    Head_of_Accounting ->  CFO
    Accountants        ->  Head_of_Accounting
    Procurement        ->  Head_of_Accounting
    Procurement        ->  COO
    Logistics          ->  COO
    Tech_support       ->  CTO
    Tech_support       ->  COO
}

Running this with the dot algorithm will generate the following graph:

Org Chart

Graphviz does have sophisticated node and edge description features such as defining the shape of the nodes, labels for edges etc. but adding such detail often reduces readability of the graph a bit because the majority of the code now looks like style definitions instead of relationships between nodes. Still, I think the graph definition itself is fairly clean. Like any language, it was intended to be used to solve human problems (in this case figuring out what a graph looks like if you know the states and transitions) and has to be at least somewhat usable for its intended use.

Surface answered 19/9, 2019 at 1:55 Comment(5)
One trick I often use is to let graphviz generate the graph in SVG and import the resulting graph into a vector editor like Inkscape or Adobe IllustratorSurface
This is a list of pairs of nodes, so no readability bonus IMO. Still a viable option due to concise syntax and built-in visualization so thanks for the answer!Energetics
Can you show what Guy Coder's examples would look like? I'd be curious how it handles non-planar DAGs as well. Is its handling of those cases configurable?Nusku
@Nusku exactly like in his answer. His answer includes exactly the same syntax as above x -> y. As for the drawing the lines would simply crossSurface
@Nusku example drawings - google.com/…Surface
E
4

I'm going to go with a YAML nested list with anchors. (Which is equivalent to XML with entities but the latter has more noise.)
(I was already considering it but was wondering if anything better has been invented. Looks like it hasn't. But most importantly, @Patrick87 formally showed that it's an adequate representation.)

It's equivalent to the formal regular expression representation suggested by @Patrick87 if I replace composition with indent and union with no indent; and the anchors allow to eliminate the duplication of a subgraph under a node when it's referenced multiple times.


E.g. @GuyCoder's example

A->B
A->C
A->D
B->E
B->F
C->E
C->G
D->F
D->G
E->H
F->H
G->H

that corresponds to A(B(E+F)+C(E+G)+D(F+G))HA(B(EH+FH)+C(EH+GH)+D(FH+GH))

would be

- A
    - B
        - &E E
            - &H H
        - &F F
            - *H
    - C
        - *E
        - &G G
            - *H
    - D
        - *F
        - *G
        

(For uniformity, every original node could be made an anchor if e.g. generating it.)


It doesn't matter if the graph is planar or not because any cross-cutting links are simply not "drawn".

As a bonus, it allows to specify the data attached to each node, as a hash table rooted at the node. (Though past a certain size, it'll probably be more clear to place the data separately.)

Energetics answered 23/9, 2019 at 16:28 Comment(0)
M
3

This is a simple variation of Visibility Representations. See: Planar Orthogonal and Polyline Drawing Algorithms Section: 7.2.3 Visibility Representations

A -> B
A -> C
A -> E
B -> D
B -> F
C -> D
C -> G
D -> H
E -> F
E -> G
E -> G
F -> H
 G--------G--------G                
 |        |        |        
 |     H--H--H     |    
 |     |     |     |
 | F---F     D---D |     
 | |   |     |   | |   
 E-E   B--B--B   C-C  
   |      |      |       
   A------A------A

Here is this

A -> B
A -> C
A -> D
B -> E
B -> F
C -> E
C -> G
D -> F
D -> G
E -> H
F -> H
G -> H

)|( represents a bridge, no connection.

          H--H--H          
          |  |  |           
  E-------E  |  G----G--G   
  |       |  |  |       |   
  |  F---)|(-F-)|(---F  |   
  |  |    |     |    |  |   
  B--B    C--C--C    D--D   
  |          |          |   
  A----------A----------A 

From: Orthogonal Graph Drawing with Constraints Figure 3.4 (a)

a -> b
a -> c
a -> d
b -> c
b -> e
c -> f
d -> e
d -> f
d -> g
e -> f
e -> h
f -> i
g -> h
g -> i
h -> i
         i---i-------i   
         |   |       |       
 f---f---f   h---h   |   
 |   |   |   |   |   |   
 |   |   e---e   g---g  
 |   |   |   |   |       
 |   d---d--)|(--d       
 |           |   |        
 c---c       |   |        
 |   |       |   |        
 |   b-------b   |        
 |   |           |        
 a---a-----------a    
Maculation answered 19/9, 2019 at 16:22 Comment(2)
Good as a visualization format but would be tricky to actually work with. On par with Git's option I'd say: better clarity and more straightforward drawing and parsing at the cost of a more complex layout and more verbosity.Energetics
I really like how these diagrams look. How hard are these to generate in terms of the number of vertices and arcs? Polynomial-time? Polylog? PSPACE?Nusku
H
2

git log --graph represents a directed graph of commits in a text manner. (In Git several commits could be branched out of a single commit, and two commits could be merged into a new one, time from older to newer commits could be a direction. So it's a directed graph without cycles)

--format...%p includes parent commits, so it might be considered as machine readable. E.g.

git log --graph --abbrev-commit --decorate --format=format:'%h - %aD %p %s'

would show something like:

*   585a502 - Mon, 23 Jul 2012 19:13:28 +0100 1ce012a 00b3327 Merge github.com:orangeduck/CPlus
|\
| *   00b3327 - Mon, 23 Jul 2012 07:38:16 -0700 9a24ec6 5c5b6e2 Merge pull request #4 from felipecruz/feature/create_tests_dir
| |\
| | * 5c5b6e2 - Mon, 23 Jul 2012 10:04:07 -0300 11fb96d move tests to tests dir
| | * 11fb96d - Sun, 22 Jul 2012 18:19:51 -0300 9a24ec6 fix variable name in Strind_Discard
| |/
* | 1ce012a - Mon, 23 Jul 2012 19:13:05 +0100 9a24ec6 Array instances Push. Used memmove for dynamic container manipulation.
|/
* 9a24ec6 - Sun, 22 Jul 2012 14:02:24 +0100 b41f9c2 Better documented source
* b41f9c2 - Sun, 22 Jul 2012 12:50:13 +0100 2f4b862 Assign class. Added WIP Array Type.

Where * - nodes, lines in prseudographics and consequent commits - edges with direction from earlier (bottom) to newer (top)

Update

Nonplanar DAG looks much more clumsy here. An example of the nonplanar one, same to this example from Wikipedia:

*   094f405 - Thu, 19 Sep 2019 03:51:50 +0300 ab942ca 76ee1ad X, Y, Z
|\
| *   76ee1ad - Thu, 19 Sep 2019 03:49:49 +0300 b1ea78b 8d32234 Y, Z
| |\
* | \   ab942ca - Thu, 19 Sep 2019 03:51:17 +0300 b20cf0b 7f714d9 XY, XZ
|\ \ \
| * \ \   7f714d9 - Thu, 19 Sep 2019 03:49:05 +0300 b84010c 8d32234 X, Z
| |\ \ \
| | | |/
| | |/|
| | * | 8d32234 - Thu, 19 Sep 2019 03:45:18 +0300 6927afa Z
* | | |   b20cf0b - Thu, 19 Sep 2019 03:47:04 +0300 b84010c b1ea78b X, Y
|\ \ \ \
| |/ / /
|/| | /
| | |/
| |/|
| * | b1ea78b - Thu, 19 Sep 2019 03:44:40 +0300 6927afa Y
| |/
* | b84010c - Thu, 19 Sep 2019 03:43:53 +0300 6927afa X
|/
* 6927afa - Thu, 19 Sep 2019 03:31:01 +0300 4bf9923 #4

Also many markdowns support directed graphs, e.g. this one (a first one from googling)

Hallock answered 18/9, 2019 at 8:17 Comment(6)
How would it show a link between non-adjacent files? E.g. a merge from 11fb96d directly to master or vice versa?Energetics
@ivan_pozdeev, I've added a picture of the directed acyclic graph, and included parent commits into the text output, so the text now has enough information for building a graph. There are non-adjacent nodes e.g. 1ce012a and 00b3327 which merges into 585a502. I'm not sure what means vise-versa, e.g. 585a502 cannot be merged back in time, as it would be cyclic graph instead (if it's about splitting, e.g. 9a24ec6 is being split into 3 non-adjacent commits)Hallock
@GuyCoder, yes Git'-commits-graph is a subset of general DAG, but the only difference is: Git mandates merges from 2 commits only (max 2 incoming arrows into a node). I think this is a minor difference (a node with n-incoming arrows could be split into n-1 nodes with 2-incoming arrows), and Git still might be used as an example of DAG.Hallock
@Hallock the edit added nothing of value (so you can as well revert it). Let me clarify what I mean by "links between non-adjacent files". There are 3 branches here: master, the root, CPlus branch and create_tests_dir branch. In the end, create_tests_dir is merge into CPlus and CPlus is merged into master. What would be shown if I also merged master into create_tests_dir between 11fb96d and 5c5b6e2?Energetics
@GuyCoder This answer conforms to the premise of the question: it's more clear than a long list of pairs of nodes, and it's widely and successfully used in production. So I don't see how it's "not useful" (the official reason for a downvote). A three-way merge can be represented as a series of two-way ones or e.g. with a construct like `|\\` so the lack of that in Git is not a show-stopper.Energetics
@ivan_pozdeev, imho this way the graph still would be a planar one. I've added an example of a nonplanar DAG.Hallock
N
1

In formal languages and automata theory, one of the first important results is the equivalence between deterministic finite automata and (formal) regular expressions. A DFA is just a labeled digraph with some extra information. I propose the following: (1) consider all states in the DAG to be accepting (2) label each arc with the label of the vertex where that arc begins (3) produce a regular expression for this DFA (choosing the topologically minimal states as starting states of distinct DFAs). First you'd want to topologically sort the vertices and then make one DFA/regular expression pair per connected component.

Example: node A goes to nodes B and C, B goes do D and E, C goes to E and F.

Topologically sorting finds the vertices in alphabetical order by label are already sorted: A, B, C, D, E. There is one connected component starting at the topologically minimal node A.

Going through the algorithm after labeling arcs might give you a regular expression like A(B(D+E)+C(E+F)).

Note that because the graphs are acyclic, you will never need the Kleene closure symbol asterisk/star. This answer could be elaborated on if there is interest.

EDIT: Some elaboration.

It was pointed out in the comments that there is some duplication in the above regular expression. This is true. However, this may not turn into catastrophic duplication: we can avoid duplicating subgraphs, at least to some degree. For instance, suppose there's a long subgraph with topologically minimal node E in the above example. Let's say it has acceptable regular expression r. Then we could adjust the above regular expression as follows: A((B+C)Er + BD + CF). There is still duplication, now between B and C rather than E, but because of the subgraph with topologically minimal node E, this is still a more concise representation.

Minimizing general regular expressions is PSPACE-complete. However, I don't know whether this bound applies to the minimization of regular expressions generated from DFAs whose graphs are DAGs. As the comments correctly note, the regular theory of DFAs and REs treats general digraphs, which are more complex than DAGs. It's entirely possible that regular expressions without the Kleene star might be easier to minimize than ones with it. This might be a question worth asking separately, possible on cs.stackexchange.com.

Another common way of representing DFAs is by using regular grammars. This is essentially equivalent to simply listing the ordered pairs of nodes corresponding to arcs in the DFA's state graph.

EDIT2: an example

Another answer had this example:

A->B
A->C
A->D
B->E
B->F
C->E
C->G
D->F
D->G
E->H
F->H
G->H

I suspect a nearly minimal regular expression as described here would be approximately the following: A(B(E+F)+C(E+G)+D(F+G))H. Our representation compares as follows:

  • 24 symbols in grammar-equivalent, but 11 in regular expression
  • 12 operators in grammar-equivalent, but 8 in regular expression
  • 36 vs 19 total tokens

It's harder to compare to the visibility graph, since the representations are so different, but the regular expression clearly uses fewer total symbols (if we are counting symbols).

EDIT 3: another example was proposed, as follows:

a -> b
a -> c
a -> d
b -> c
b -> e
c -> f
d -> e
d -> f
d -> g
e -> f
e -> h
f -> i
g -> h
g -> i
h -> i

The most concise regular expression I could come up with by hand (second guess, no methodology) is this: a((b+d)e(f+h)+(bc+c+d)f+dg(h+#))i . Note the # is not part of the usual formal regular expression syntax and represents the empty regular expression, that is, it generates the language consisting of the empty string. This is a convenience to allow better minimzation and adds no computational power, only expressive. If you don't like it, you can use dgh + dh instead, it's only one symbol longer. This representation is still around half the size of the original grammar. Actually, the comparisons to both the grammar and the visibility graph are similar w.r.t. those of the last example.

EDIT 4: I will now expand the expression from the last example to show it is a factored representation of a disjoint union of paths through the DAG.

a((b+d)e(f+h)+(bc+c+d)f+dg(h+#))i
a((b+d)e(f+h)+(bc+c+d)f+dgh+dg)i
a((b+d)ef+(b+d)eh+(bc+c+d)f+dgh+dg)i
a(bef+def+beh+deh+(bc+c+d)f+dgh+dg)i
a(bef+def+beh+deh+bcf+cf+df+dgh+dg)i
abefi+adefi+abehi+adehi+abcfi+acfi+adfi+adghi+adgi
Nusku answered 19/9, 2019 at 3:9 Comment(11)
(Note also that the other canonical way of representing DFAs is using regular grammars, which is essentially what slebetman's answer proposes. A grammar lists all productions which corresponds basically to listing every ordered pair of nodes connected by an arc.)Nusku
(Note also some may dispute whether regular expressions are human readable.)Nusku
Looks promising. REs are more readable than a list of 2-tuples even though it deteriorates quickly with scaling.Energetics
What strikes me as problematic is the repeating "E". If there's a subgraph beyond E, will it be duplicated, too? E.g. if also E and F go to G?Energetics
And if I replace concatenation with indentation and union with no indentation, I'll end up with a YAML lookalike.Energetics
I think if you elaborate on those "two canonical ways of representing DFAs and how this hooks up with DAGs (DFAs are more general IIRC, they are arbitrary DGs), this will be a canonical answer candidate as an overview of everything that contemporary CS theory has to say on the topic.Energetics
@Energetics I have updated the answer, please see if you feel this improves it any. After rereading your question I noticed you mention the application is flowcharts. In light of that, this answer may be even more like what you're after than I realized. DFAs are exactly flowcharts and there is a rich theory around them and transforming them into regular expressions, regular grammars, and back again. You will probably be helped by the fact your graphs are acyclic; it will probably make all problems even easier than they already are in the theory of general (cyclic) automata.Nusku
@GuyCoder the H at the end encodes the fact that all paths through the DAG end at H. You can use distributive laws like those for multiplication and addition (here, concatenation and union) to expand this consolidated expression into a union of all simple paths from A to H. But generally I'd agree that regular expressions are not necessarily "clearer" than grammars, but they can be more concise (and sometimes they provide insights a grammar might not). And vice versa, of course.Nusku
@GuyCoder I added a representation for your latest example. You can think of this as factoring out common subpaths, ideally in such a way as to "simplify" the resulting algebraic expression. If you distribute the "multiplication" fully you should find a list of all paths from a to i separated by "plus" (should, if I did the algebra right).Nusku
@GuyCoder I did the algebra and the result looks right based on the graph you did. My original expression was missing an f that I added (either I factored wrong at the time or just forgot to type that part). The terms in the last line are exactly the paths through your graph. Pairs of adjacent symbols in the terms correspond exactly to productions of the grammar.Nusku
@GuyCoder Right, this encodes paths rather than connections. If the DAG were a DFA, these terms would be the strings accepted by the automaton, and the RE would match these strings. The DFA (and grammar, which is the list of connections) can be recovered from the RE if you like, using known algorithms, and it is likely much easier to do for this subset of REs than it is in the general case. Depending on the application, you might care about entire paths more than indicidual connections anyway (e.g., pattern matching). Whether this is more or less useful to OP, only OP can say.Nusku

© 2022 - 2024 — McMap. All rights reserved.