Python: How to save statsmodels results as image file?
Asked Answered
B

1

9

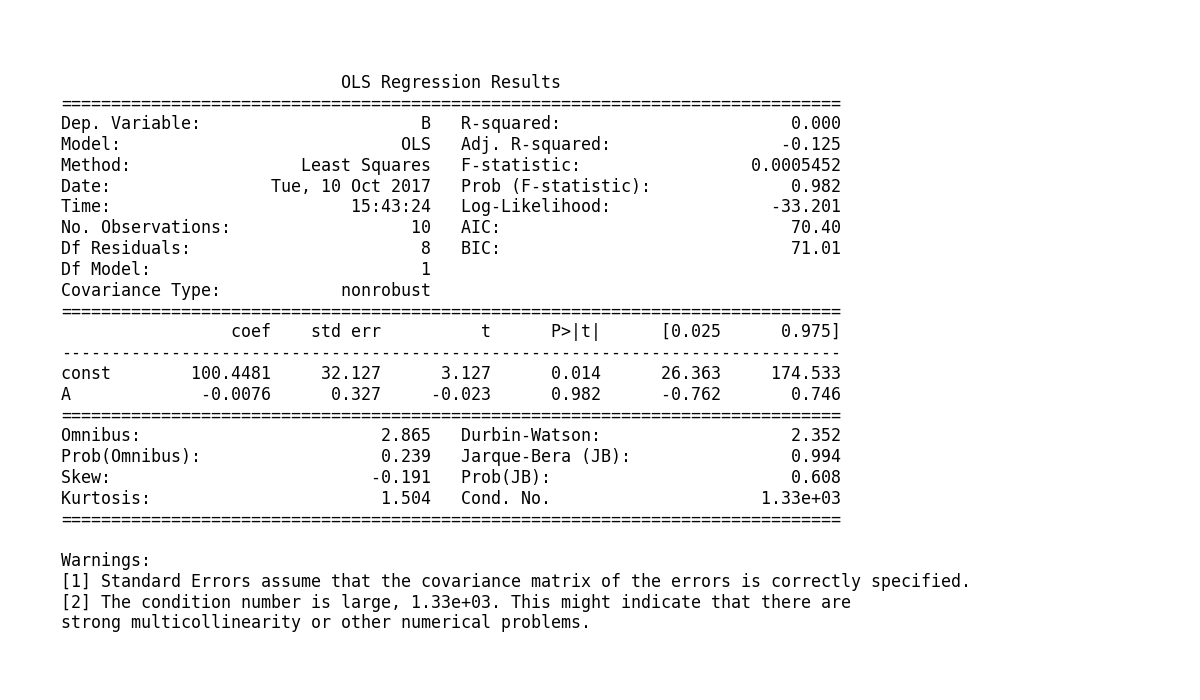
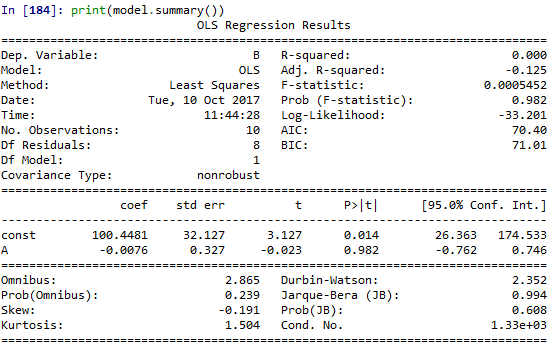
I'm using statsmodels to make OLS estimates. The results can be studied in the console using print(results.summary()). I'd like to store the very same table as a .png file. Below is a snippet with a reproducible example.

import pandas as pd
import numpy as np
import matplotlib.dates as mdates
import statsmodels.api as sm

# Dataframe with some random numbers
np.random.seed(123)
rows = 10
df = pd.DataFrame(np.random.randint(90,110,size=(rows, 2)), columns=list('AB'))
datelist = pd.date_range(pd.datetime(2017, 1, 1).strftime('%Y-%m-%d'), periods=rows).tolist()
df['dates'] = datelist 
df = df.set_index(['dates'])
df.index = pd.to_datetime(df.index)
print(df)

# OLS estimates using statsmodels.api
x = df['A']
y = df['B']

model = sm.OLS(y,sm.add_constant(x)).fit()

# Output
print(model.summary())

enter image description here

I've made some naive attempts using suggestions here, but I suspect I'm way off target:

os.chdir('C:/images')
sys.stdout = open("model.png","w")
print(model.summary())
sys.stdout.close()

So far this only raises a very long error message.

Thank you for any suggestions!

Breathtaking answered 10/10, 2017 at 10:8 Comment(0)
E
19

This is a pretty unusual task and your approach is kind of crazy. You are trying to combine a string (which has no positions in some metric-space) with some image (which is based on absolute positions; at least for pixel-based formats -> png, jpeg and co.).

No matter what you do, you need some text-rendering engine!

I tried to use pillow, but results are ugly. Probably because it's quite limited and a post-processing anti-aliasing is not saving anything. But maybe i did something wrong.

from PIL import Image, ImageDraw, ImageFont
image = Image.new('RGB', (800, 400))
draw = ImageDraw.Draw(image)
font = ImageFont.truetype("arial.ttf", 16)
draw.text((0, 0), str(model.summary()), font=font)
image = image.convert('1') # bw
image = image.resize((600, 300), Image.ANTIALIAS)
image.save('output.png')

When you use statsmodels, i assume you already got matplotlib. This one can be used too. Here is some approach, which is quite okay, although not perfect (some line-shifts; i don't know why; edit: OP managed to repair these by using a monospace-font):

import matplotlib.pyplot as plt
fig, ax = plt.subplots(figsize=(16, 8))
summary = []
model.summary(print_fn=lambda x: summary.append(x))
summary = '\n'.join(summary)
ax.text(0.01, 0.05, summary, fontfamily='monospace', fontsize=12)
ax.axis('off')
plt.tight_layout()
plt.savefig('output.png', dpi=300, bbox_inches='tight')

Output:

enter image description here

Edit: OP managed to improve the matplotlib-approach by using a monospace-font! I incorporated that here and it's reflected in the output image.

Take this as a demo and research python's text-rendering options. Maybe the matplotlib-approach can be improved, but maybe you need to use something like pycairo. Some SO-discussion.

Remark: On my system your code does give those warnings!

Edit: It seems you can ask statsmodels for a latex-representation. So i recommend using this, probably writing this to a file and use subprocess to call pdflatex or something similar (here some similar approach). matplotlib can use latex too (but i won't test it as i'm currently on windows) but in this case we again need to tune text to window ratios somehow (compared to a full latex document given some A5-format for example).

Emirate answered 10/10, 2017 at 10:58 Comment(5)
Thank you! As you suggest, I'll dive right into the text-rendering options and see what I can make of it.Breathtaking
Your suggestion regarding matplotlib did the trick when I tried an equally spaced font: plt.text(0.01, 0.05, str(results1.summary()), {'fontsize': 10}, fontproperties = 'monospace') Thanks again!Breathtaking
Ah, very nice. I still consider this approach sub-par compared to full-latex. But who knows what you need. The downsides of the matplotlib-approach is manual-tuning like i did. But thanks for mentioning the font-stuff!Emirate
I'm making visualizations of the relationships between a bunch of variables using matplotlib. Then I save the plots as png files, and throw them into PowerPoint presentations. With your matplotlib suggestion I'm able to do the same thing with the actual model results following a slide with the plots. So this is a very valuable addition to my existing work flow. Simple, but effective.Breathtaking
The print_fn is not recognized by m statsmodels. What's the replacement?Suanne

© 2022 - 2024 — McMap. All rights reserved.