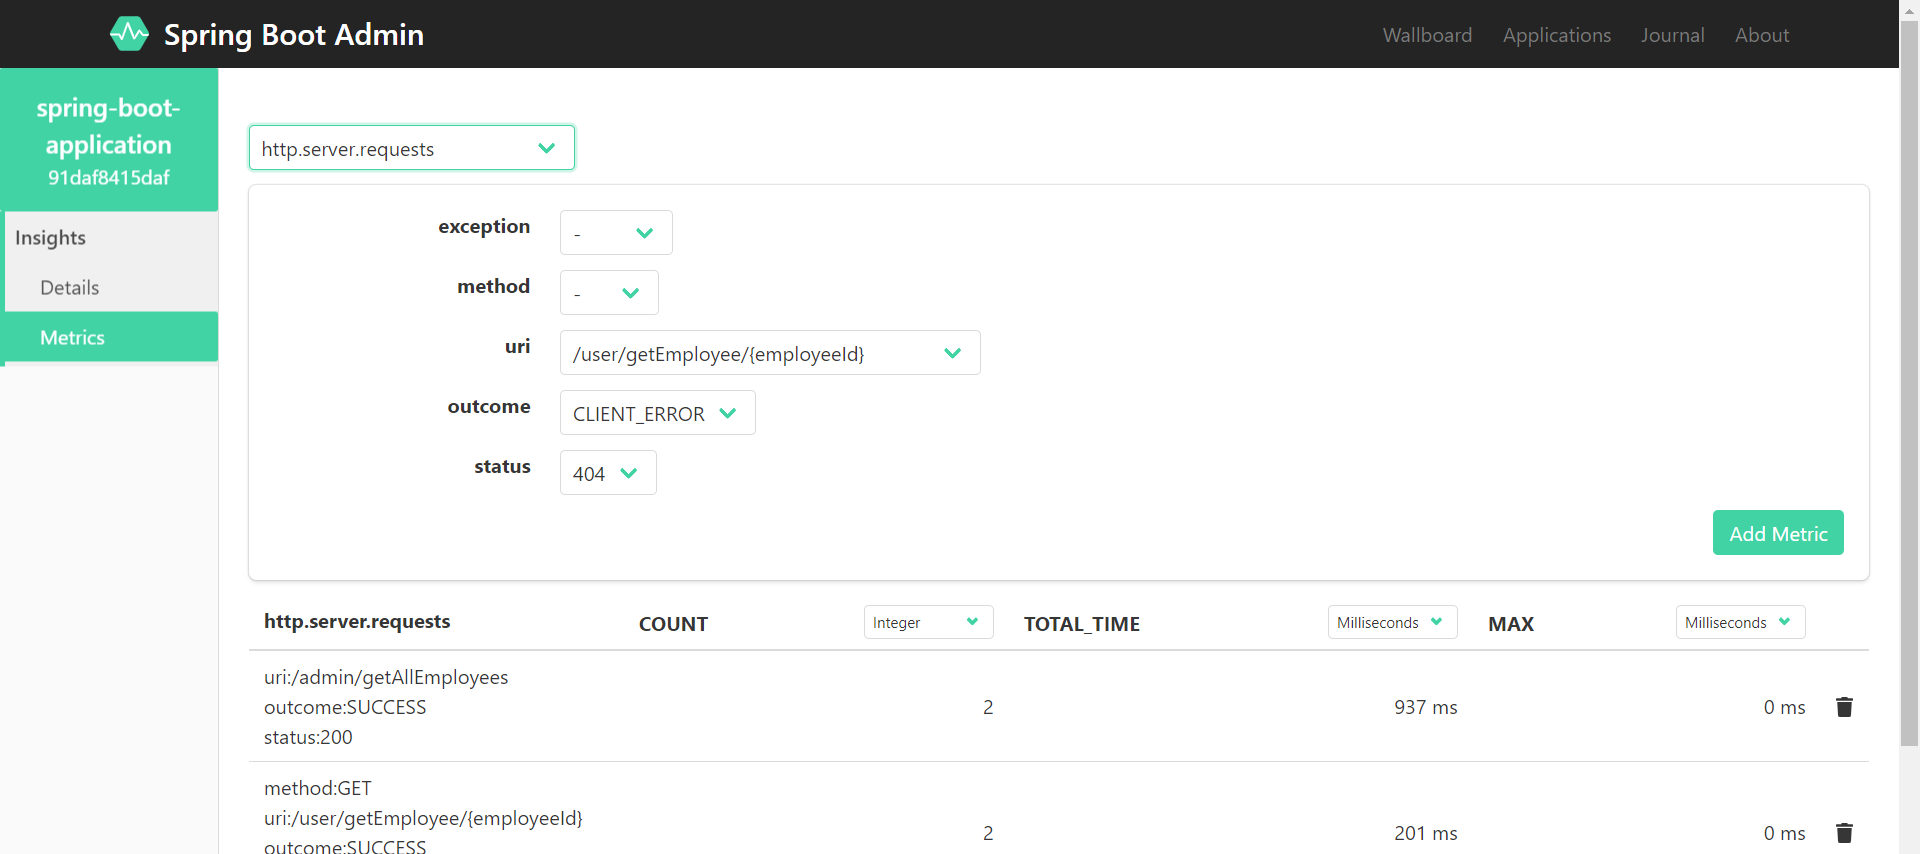
You can use Spring Boot /actuator/metrics/http.server.requests to get all endPoints which are executed with their count, exception, outcome, status, total time, etc as follow.
If you want to see details for particular endPoint then you can do it by calling request as follow
localhost:8889/actuator/metrics/http.server.requests?tag=uri:<endPoint>
localhost:8889/actuator/metrics/http.server.requests?tag=uri:/user/asset/getAllAssets
localhost:8889/actuator/metrics/http.server.requests?tag=uri:/user/asset/getAllAssets&tag=status:200
- You will get
COUNT as how many times particular endPoint has been
called
- You will get
COUNT as how many times particular endPoint has been
called with a particular Status
- To get the average time to execute endPoint you can do
TOTAL_TIME/COUNT for particular endPoint as well as for whole
application
localhost:8889/actuator/metrics/http.server.requests
{
    "name": "http.server.requests",
    "description": null,
    "baseUnit": "seconds",
    "measurements": [
        {
            "statistic": "COUNT",
            "value": 3
        },
        {
            "statistic": "TOTAL_TIME",
            "value": 0.21817219999999998
        },
        {
            "statistic": "MAX",
            "value": 0.1379249
        }
    ],
    "availableTags": [
        {
            "tag": "exception",
            "values": [
                "MethodArgumentTypeMismatchException",
                "None"
            ]
        },
        {
            "tag": "method",
            "values": [
                "GET"
            ]
        },
        {
            "tag": "uri",
            "values": [
                "/{id}.*",
                "/user/asset/getAsset/{assetId}",
                "/user/asset/getAllAssets"
            ]
        },
        {
            "tag": "outcome",
            "values": [
                "CLIENT_ERROR",
                "SUCCESS"
            ]
        },
        {
            "tag": "status",
            "values": [
                "400",
                "404",
                "200"
            ]
        }
    ]
}
localhost:8889/actuator/metrics/http.server.requests?tag=uri:/user/asset/getAllAssets
{
    "name": "http.server.requests",
    "description": null,
    "baseUnit": "seconds",
    "measurements": [
        {
            "statistic": "COUNT",
            "value": 1
        },
        {
            "statistic": "TOTAL_TIME",
            "value": 0.1379249
        },
        {
            "statistic": "MAX",
            "value": 0
        }
    ],
    "availableTags": [
        {
            "tag": "exception",
            "values": [
                "None"
            ]
        },
        {
            "tag": "method",
            "values": [
                "GET"
            ]
        },
        {
            "tag": "outcome",
            "values": [
                "SUCCESS"
            ]
        },
        {
            "tag": "status",
            "values": [
                "200"
            ]
        }
    ]
}


