How to plot horizontal line in Timeseries in Grafana
Asked Answered
T

4

9

I use grafana to plot timeseries data. In a timeseries plot i want to add a constant line which comes from a monitoring level. The value of that level is dynamic (from a postgres database) the timeseries come from a ifluxdb Datasource.

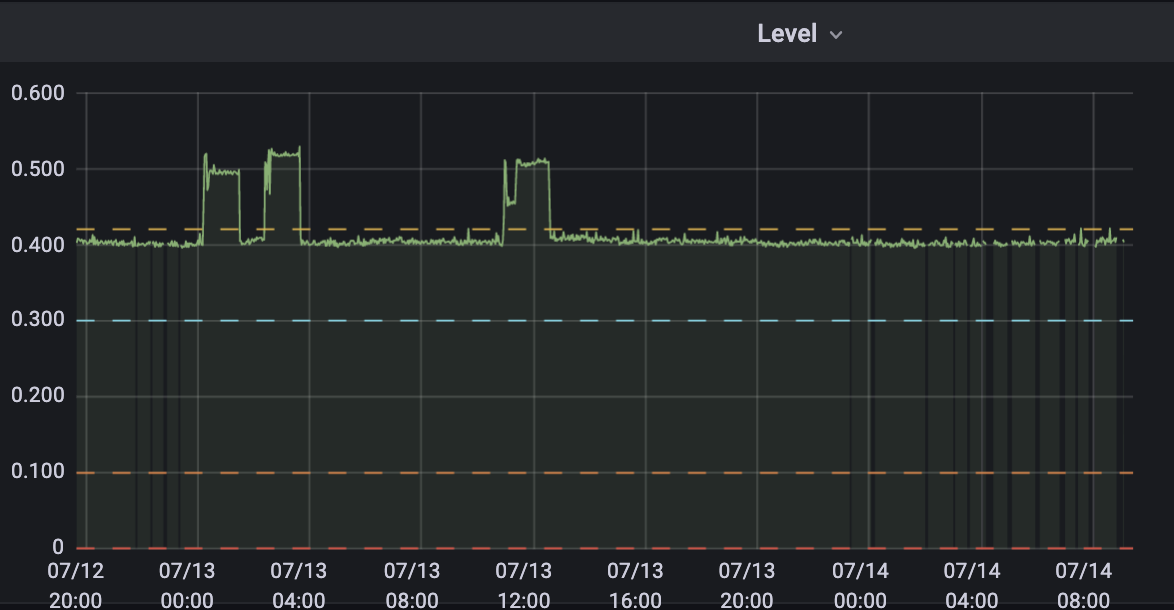
The monitoring level have no timestamp. The result should look like this:

enter image description here

I have searched quite a while how to do this, but not found a good explanation.

Torgerson answered 15/7, 2021 at 11:48 Comment(0)
D
8

It is possible to add dynamic thresholds using the Config from query option.

  1. Add a new query below your standard metric query. This will likely be called B (tip: rename this to something more descriptive).

    Here you query the static reference value. Eg SELECT expected_number_of_widgets FROM baseline

  2. Open Transformation tab

  3. Find Configuration from Query results

  4. Choose Config query = B

  5. At the dropdown for expected_number_of_widgets, choose Use as: Threshold1.

  6. In the right panel, under Thresholds, make sure Show Tresholds is enabled and remove the default threshold of 80.

For more details, see https://grafana.com/docs/grafana/latest/panels-visualizations/query-transform-data/transform-data/#config-from-query-results

Dalmatia answered 21/2, 2023 at 5:26 Comment(2)
Good solution, I tried it, but could not make threshold to be visible, though "Show Thresholds" was set to "As lines".Caracaraballo
This works great, thank you! I'd like to use multiple thresholds, e.g. a benchmark and 20% above that benchmark. My query can return multiple columns, but a Threshold2, Threshold3, etc. does not appear. When I choose Threshold1 on a second transformation, it replaces the first transformation line.Scalable
H
9

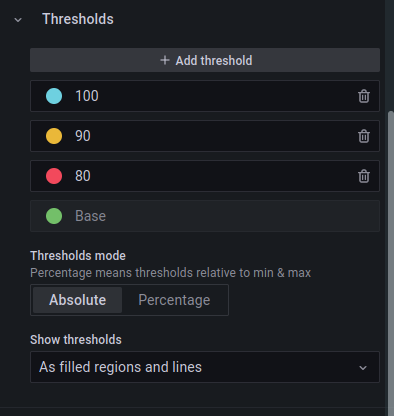
You can now add thresholds (bottom of the edit screen).

Each threshold can be represented as a solid line and/or region with individual color

enter image description here

Herefordshire answered 1/8, 2022 at 12:23 Comment(2)
How can you read the thresholds from a datasource?Torgerson
I don't know if thresholds can be dynamically read from a datasource (I understand that's what you want to do?). At time of writing the above answer all you could do what hard code them if I remember correctly. edit: @HTE seems to have a solution for dynamic thresholdHerefordshire
D
8

It is possible to add dynamic thresholds using the Config from query option.

  1. Add a new query below your standard metric query. This will likely be called B (tip: rename this to something more descriptive).

    Here you query the static reference value. Eg SELECT expected_number_of_widgets FROM baseline

  2. Open Transformation tab

  3. Find Configuration from Query results

  4. Choose Config query = B

  5. At the dropdown for expected_number_of_widgets, choose Use as: Threshold1.

  6. In the right panel, under Thresholds, make sure Show Tresholds is enabled and remove the default threshold of 80.

For more details, see https://grafana.com/docs/grafana/latest/panels-visualizations/query-transform-data/transform-data/#config-from-query-results

Dalmatia answered 21/2, 2023 at 5:26 Comment(2)
Good solution, I tried it, but could not make threshold to be visible, though "Show Thresholds" was set to "As lines".Caracaraballo
This works great, thank you! I'd like to use multiple thresholds, e.g. a benchmark and 20% above that benchmark. My query can return multiple columns, but a Threshold2, Threshold3, etc. does not appear. When I choose Threshold1 on a second transformation, it replaces the first transformation line.Scalable
T
2

To draw a line like that you have to "fake" a timeseries. (thresholds don't work since they can not be dynamic as far as I know)

First thing to keep in mind is that grafana needs timestamp to plot it, for this reason the global variables ${__to} and ${__from} come in handy.

Then, to draw a line, grafana needs at least two points. ([t0, t1][y0, y1])

So this is the sql (postgre) query that lead to the desired result:

SELECT
  ${__from} AS time,
  level_1,
FROM my_table where display_name = '${my_grafana_var:raw}'
union all
SELECT
  ${__to} AS time,
  level_1,
FROM my_table where display_name = '${my_grafana_var:raw}';
Torgerson answered 15/7, 2021 at 11:58 Comment(0)
C
2

Another way to do it in a dirty way is to create panel with a mixed data source. Create your variable in grafana - it can be a query, constant or custom. Just remember to keep it a single floating point. Add your original query and add the prometheus data source to query your variable.

${net_ordered_storage}

You will have to play a little bit with the number of data points displayed (query options>max data points) and minimum step of data point in prometheus query to make grafana connect dots.

Green horizontal line from variable

Caffeine answered 18/3, 2022 at 14:41 Comment(0)

© 2022 - 2024 — McMap. All rights reserved.