I am trying to implement click event on Stacked Bar chart.
The data looks like below:
var chartData = {
    type: 'horizontalBar',
    data: {
        labels: ['A0224', 'A3681', 'A3984', 'A4101', 'A4150', 'B0682', 'Others'],
        datasets: [
            {
                label: "P1",
                backgroundColor: '#cc3399',
                data: [6, 7, 6, 8, 6, 10, 3]
            },
            {
                label: "P2",
                backgroundColor: '#0099ff',
                data: [8, 9, 5, 8, 6, 10, 3]
            },
            {
                label: "P3",
                backgroundColor: '#0022ff',
                data: [6, 7, 6, 8, 6, 10, 3]
            }
        ]
    },
    options: {
        legend: { display: false },
        scales: {
            yAxes: [{
                stacked: true
            }],
            xAxes: [{
                stacked: true
            }]
        },

    }
}
The method for click event and chart creation looks like below:
var myChart = new
    Chart(document.getElementById("createCurrYearHccGapChart"),
    chartData);
var canvas = document.getElementById('createCurrYearHccGapChart');
canvas.onclick = function (evt) {
    var activePoints = myChart.getElementsAtEvent(evt);
    var cdata = activePoints[0]['_chart'].config.data;
    var idx = activePoints[0]['_index'];
    var label = cdata.datasets[idx].label;
    var value = cdata.datasets[0].data[idx];
};
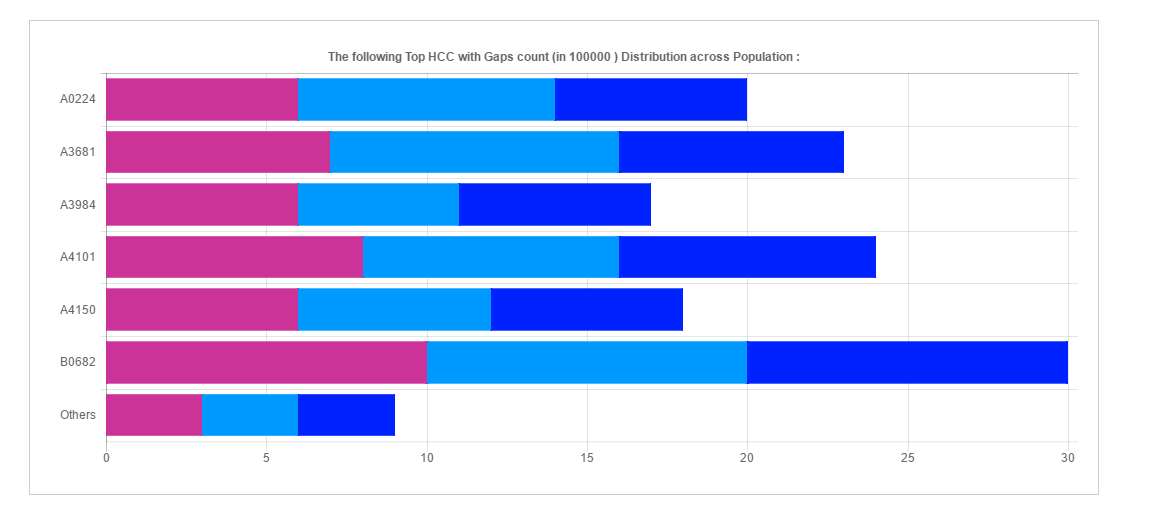
And the chart looks like below :
Below are the values i am getting wherever i click on single bar:
Bar 1 - label = P1, value = 6
Bar 2 - label = P2, value = 7
Bar 3 - label = P3, value = 6 and etc...
Problem:
So wherever i click on the 1st bar the label is P1 its because i am getting the index value as 0 for the entire bar and 1 for bar 2 and so on.
Question:
Is there any way to identify the x coordinate value? so that i can identify the click is from which stack.

