I've got a web server written in Go.
tlsConfig := &tls.Config{
    PreferServerCipherSuites: true,
    MinVersion:               tls.VersionTLS12,
    CurvePreferences: []tls.CurveID{
        tls.CurveP256,
        tls.X25519,
    },
    CipherSuites: []uint16{
        tls.TLS_ECDHE_ECDSA_WITH_AES_256_GCM_SHA384,
        tls.TLS_ECDHE_RSA_WITH_AES_256_GCM_SHA384,
        tls.TLS_ECDHE_ECDSA_WITH_CHACHA20_POLY1305,
        tls.TLS_ECDHE_RSA_WITH_CHACHA20_POLY1305,
        tls.TLS_ECDHE_ECDSA_WITH_AES_128_GCM_SHA256,
        tls.TLS_ECDHE_RSA_WITH_AES_128_GCM_SHA256,
    },
}

s := &http.Server{
    ReadTimeout:  5 * time.Second,
    WriteTimeout: 10 * time.Second,
    IdleTimeout:  120 * time.Second,
    Handler:      r, // where r is my router
    TLSConfig:    tlsConfig,
}

// redirect http to https
redirect := &http.Server{
    ReadTimeout:  5 * time.Second,
    WriteTimeout: 10 * time.Second,
    IdleTimeout:  120 * time.Second,
    Handler: http.HandlerFunc(func(w http.ResponseWriter, r *http.Request) {
        w.Header().Set("Connection", "close")
        url := "https://" + r.Host + r.URL.String()
        http.Redirect(w, r, url, http.StatusMovedPermanently)
    }),
}
go func() {
    log.Fatal(redirect.ListenAndServe())
}()

log.Fatal(s.ListenAndServeTLS(certFile, keyFile))
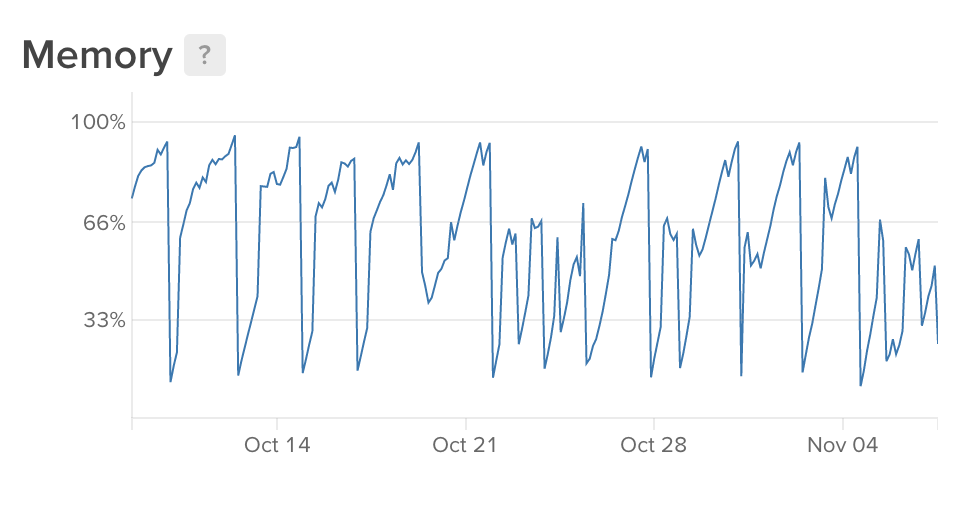
Here is a screenshot from my Digital Ocean dashboard.
As you can see memory keeps growing and growing. So I started looking at https://github.com/google/pprof. Here is the output of top5.
Type: inuse_space
Time: Nov 7, 2018 at 10:31am (CET)
Entering interactive mode (type "help" for commands, "o" for options)
(pprof) top5
Showing nodes accounting for 289.50MB, 79.70% of 363.24MB total
Dropped 90 nodes (cum <= 1.82MB)
Showing top 5 nodes out of 88
      flat  flat%   sum%        cum   cum%
  238.98MB 65.79% 65.79%   238.98MB 65.79%  crypto/tls.(*block).reserve
   20.02MB  5.51% 71.30%    20.02MB  5.51%  crypto/tls.Server
   11.50MB  3.17% 74.47%    11.50MB  3.17%  crypto/aes.newCipher
   10.50MB  2.89% 77.36%    10.50MB  2.89%  crypto/aes.(*aesCipherGCM).NewGCM
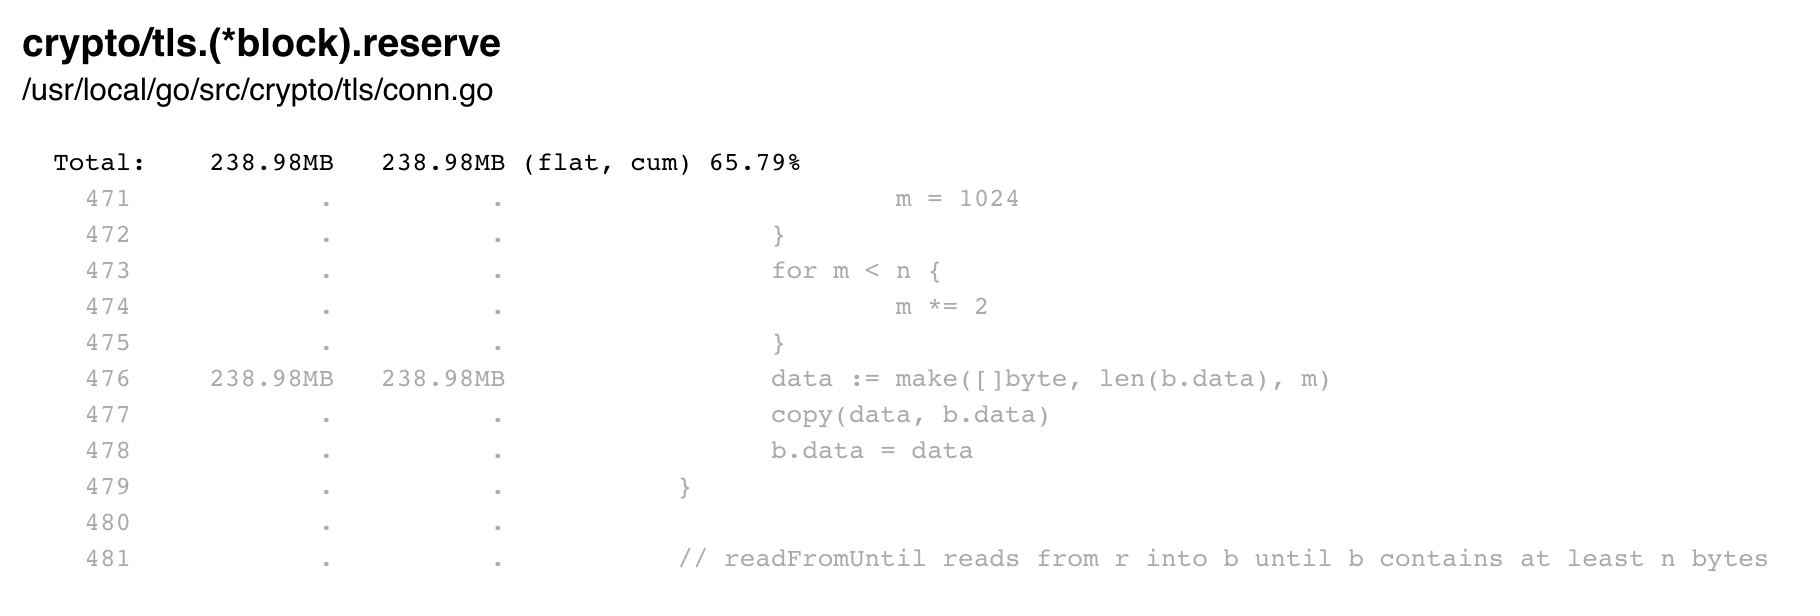
The SVG shows the same huge amount of memory allocated by crypto/tls.(*block).reserve.
Here is the exact code.
I spent the last days reading every article, document, blog post, source code, help file I could find. However nothing helps. The code is running on a Ubuntu 17.10 x64 machine using Go 1.11 inside a Docker container.
It looks like the server doesn't close the connections to the client. I thought setting all the xyzTimeout would help but it didn't.
Any ideas?
Edit 12/20/2018:
fixed now https://github.com/golang/go/issues/28654#issuecomment-448477056


s.SetKeepAlivesEnabled(false)to disable it (but verify that this actually works for HTTP 2.0). In any case, the IdleTimeout should indeed close idle connections automatically. How many active connections are there when the memory consumption is high? Is the server directly exposed to the Internet or is there a proxy involved? – Tisatisaneoom killer. I would also say the time spans are too long for being caused by the GC. – Quintongo tool pprofbut am no closer to a solution than I was when my program first ran into its container's memory limit... – Breakage