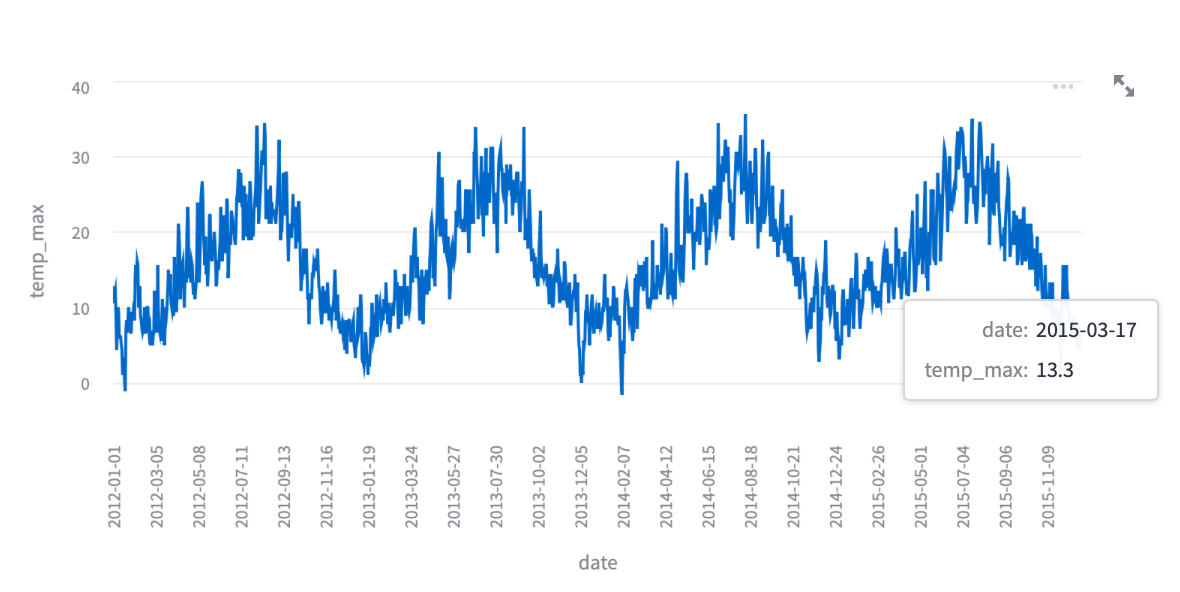
In the newest version v1.12.0 you could use the arguments x and y to specify what you want to plot from your dataframe. x is:
Column name to use for the x-axis. If None, uses the data index for
the x-axis. This argument can only be supplied by keyword.
And y is:
Column name(s) to use for the y-axis. If a sequence of strings, draws
several series on the same chart by melting your wide-format table
into a long-format table behind the scenes. If None, draws the data of
all remaining columns as data series. This argument can only be
supplied by keyword.
Here is a reproducible example using the dataset from the link above:
# import packages
import streamlit as st
import pandas as pd

# Example dataframe
df = pd.read_csv('seattle-weather.csv')

# plot
st.line_chart(data = df, x= "date", y = "temp_max")
Output:
![enter image description here]()
As you can see it has labels for the x-axis and y-axis.

