How to extract a rectangle in an image from identified lines
Asked Answered
I

1

10

(See below for update with partially working code.)

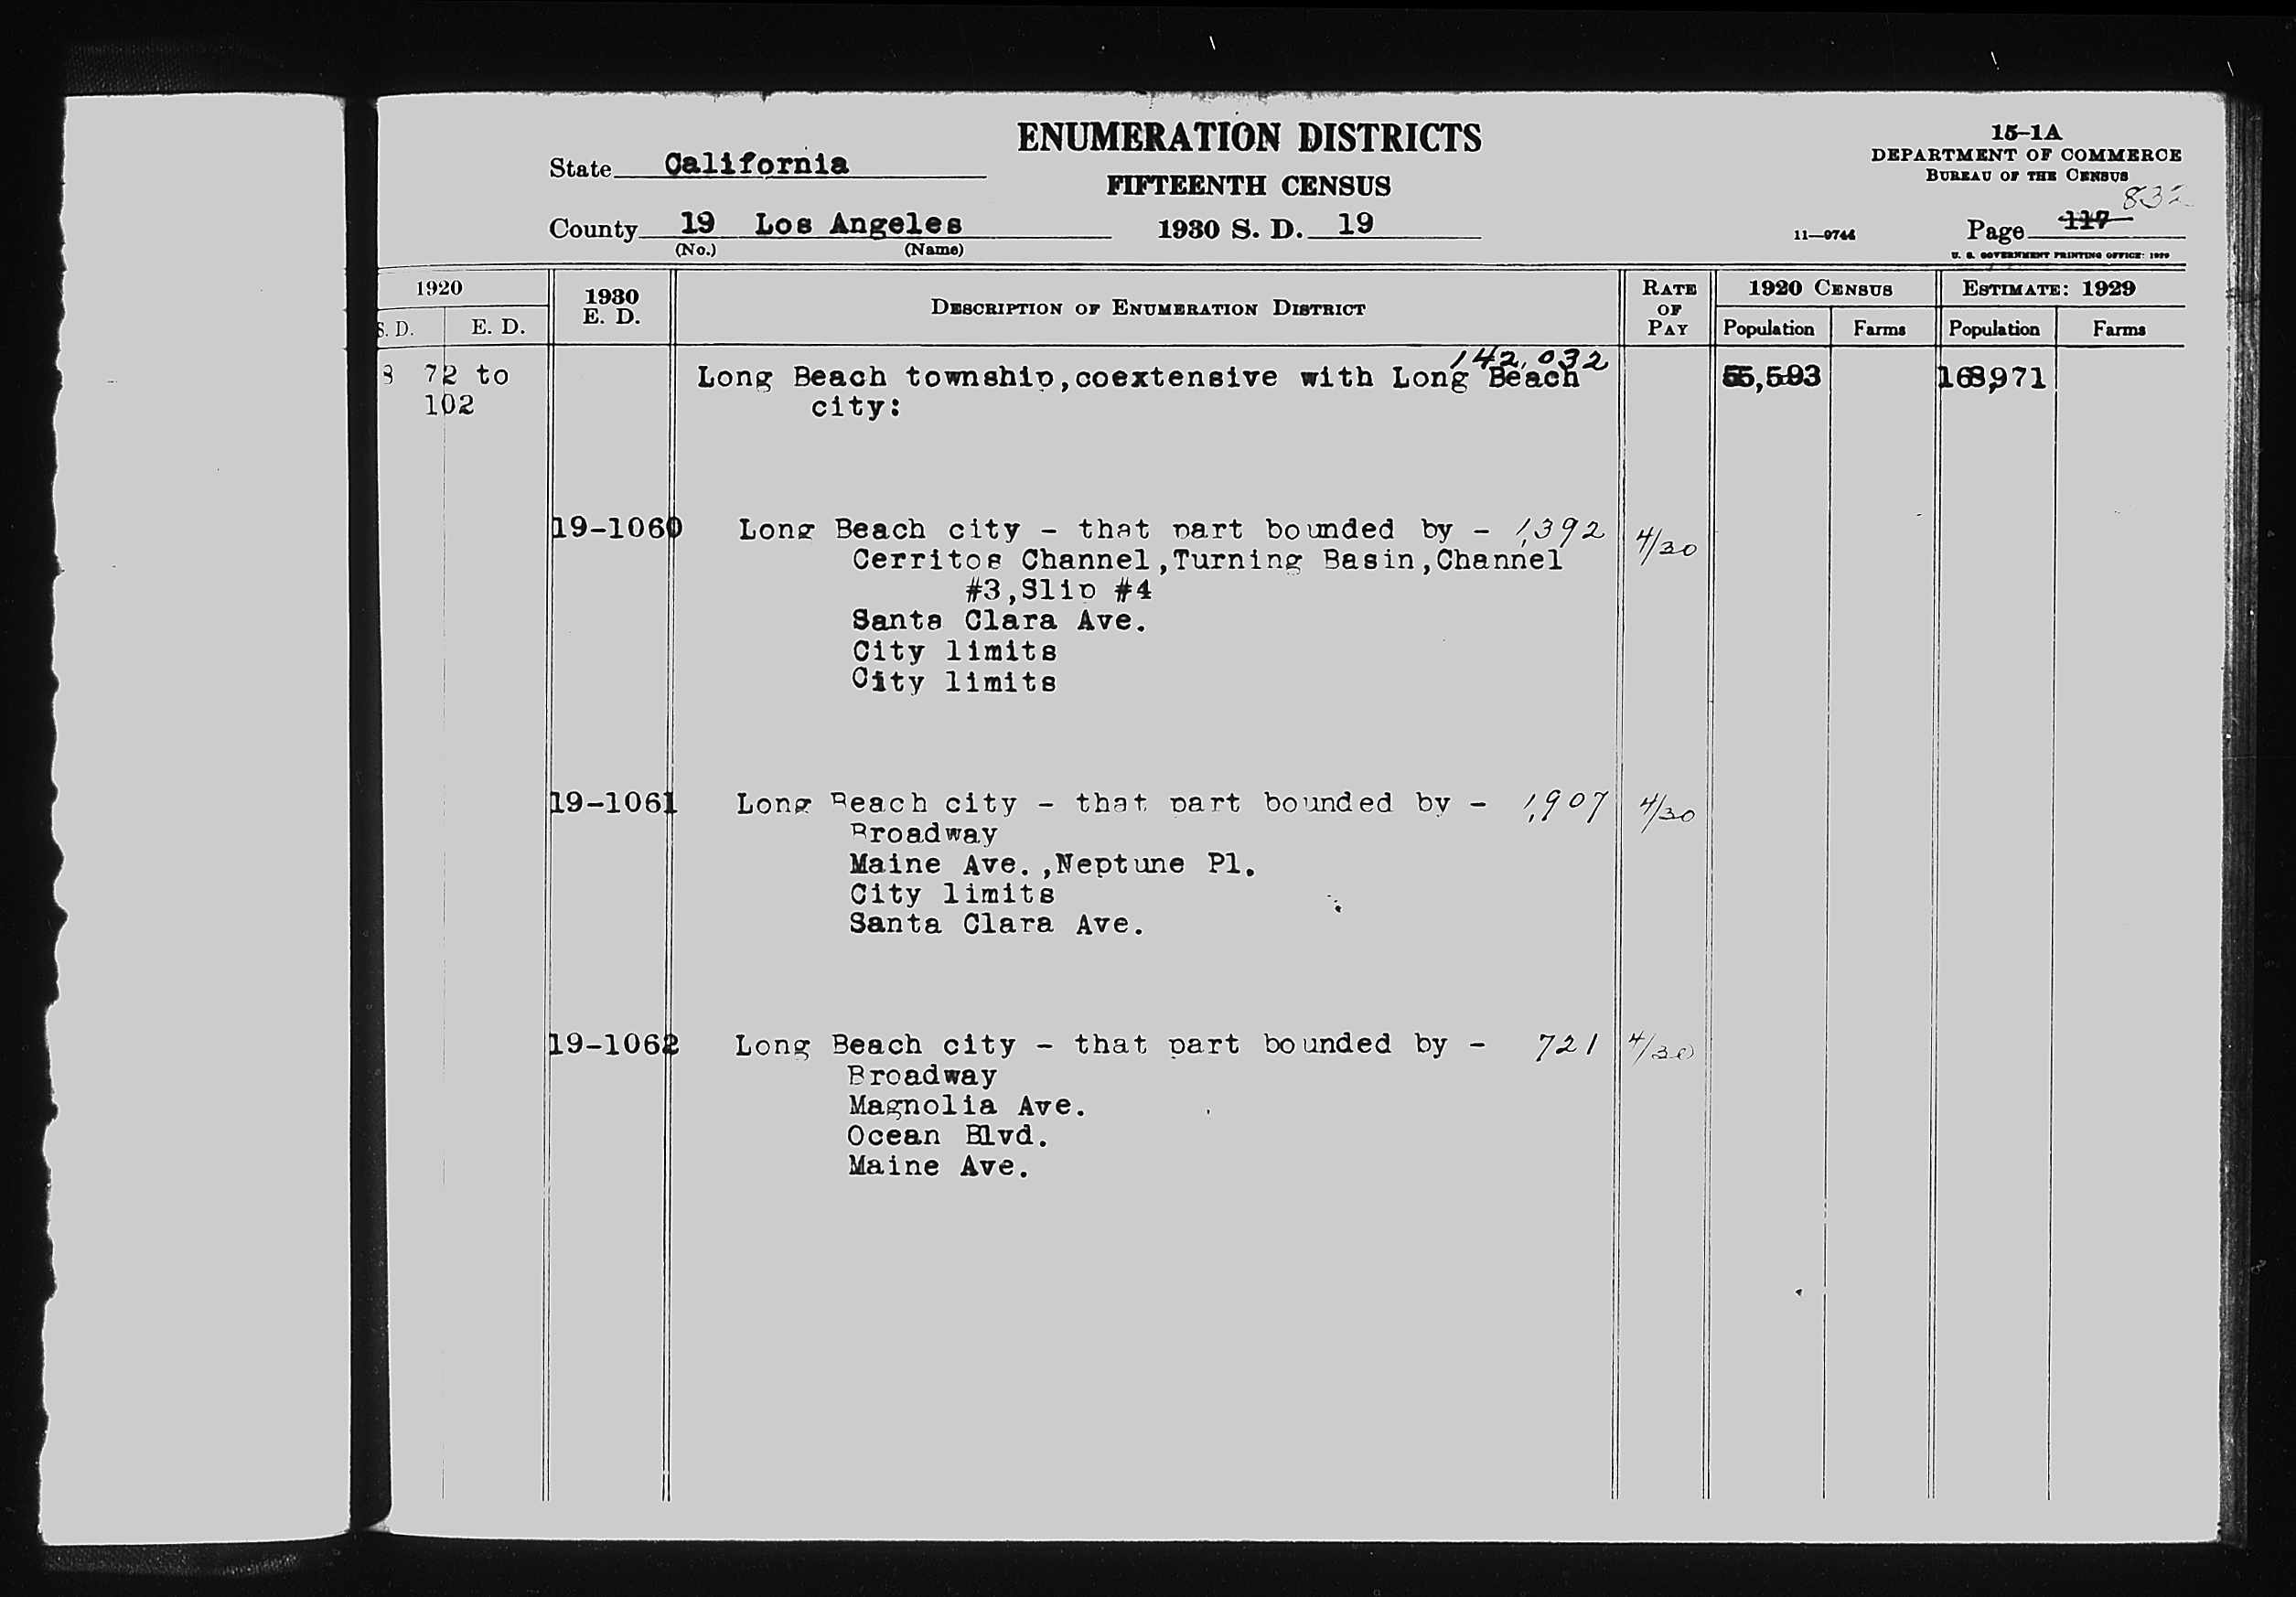
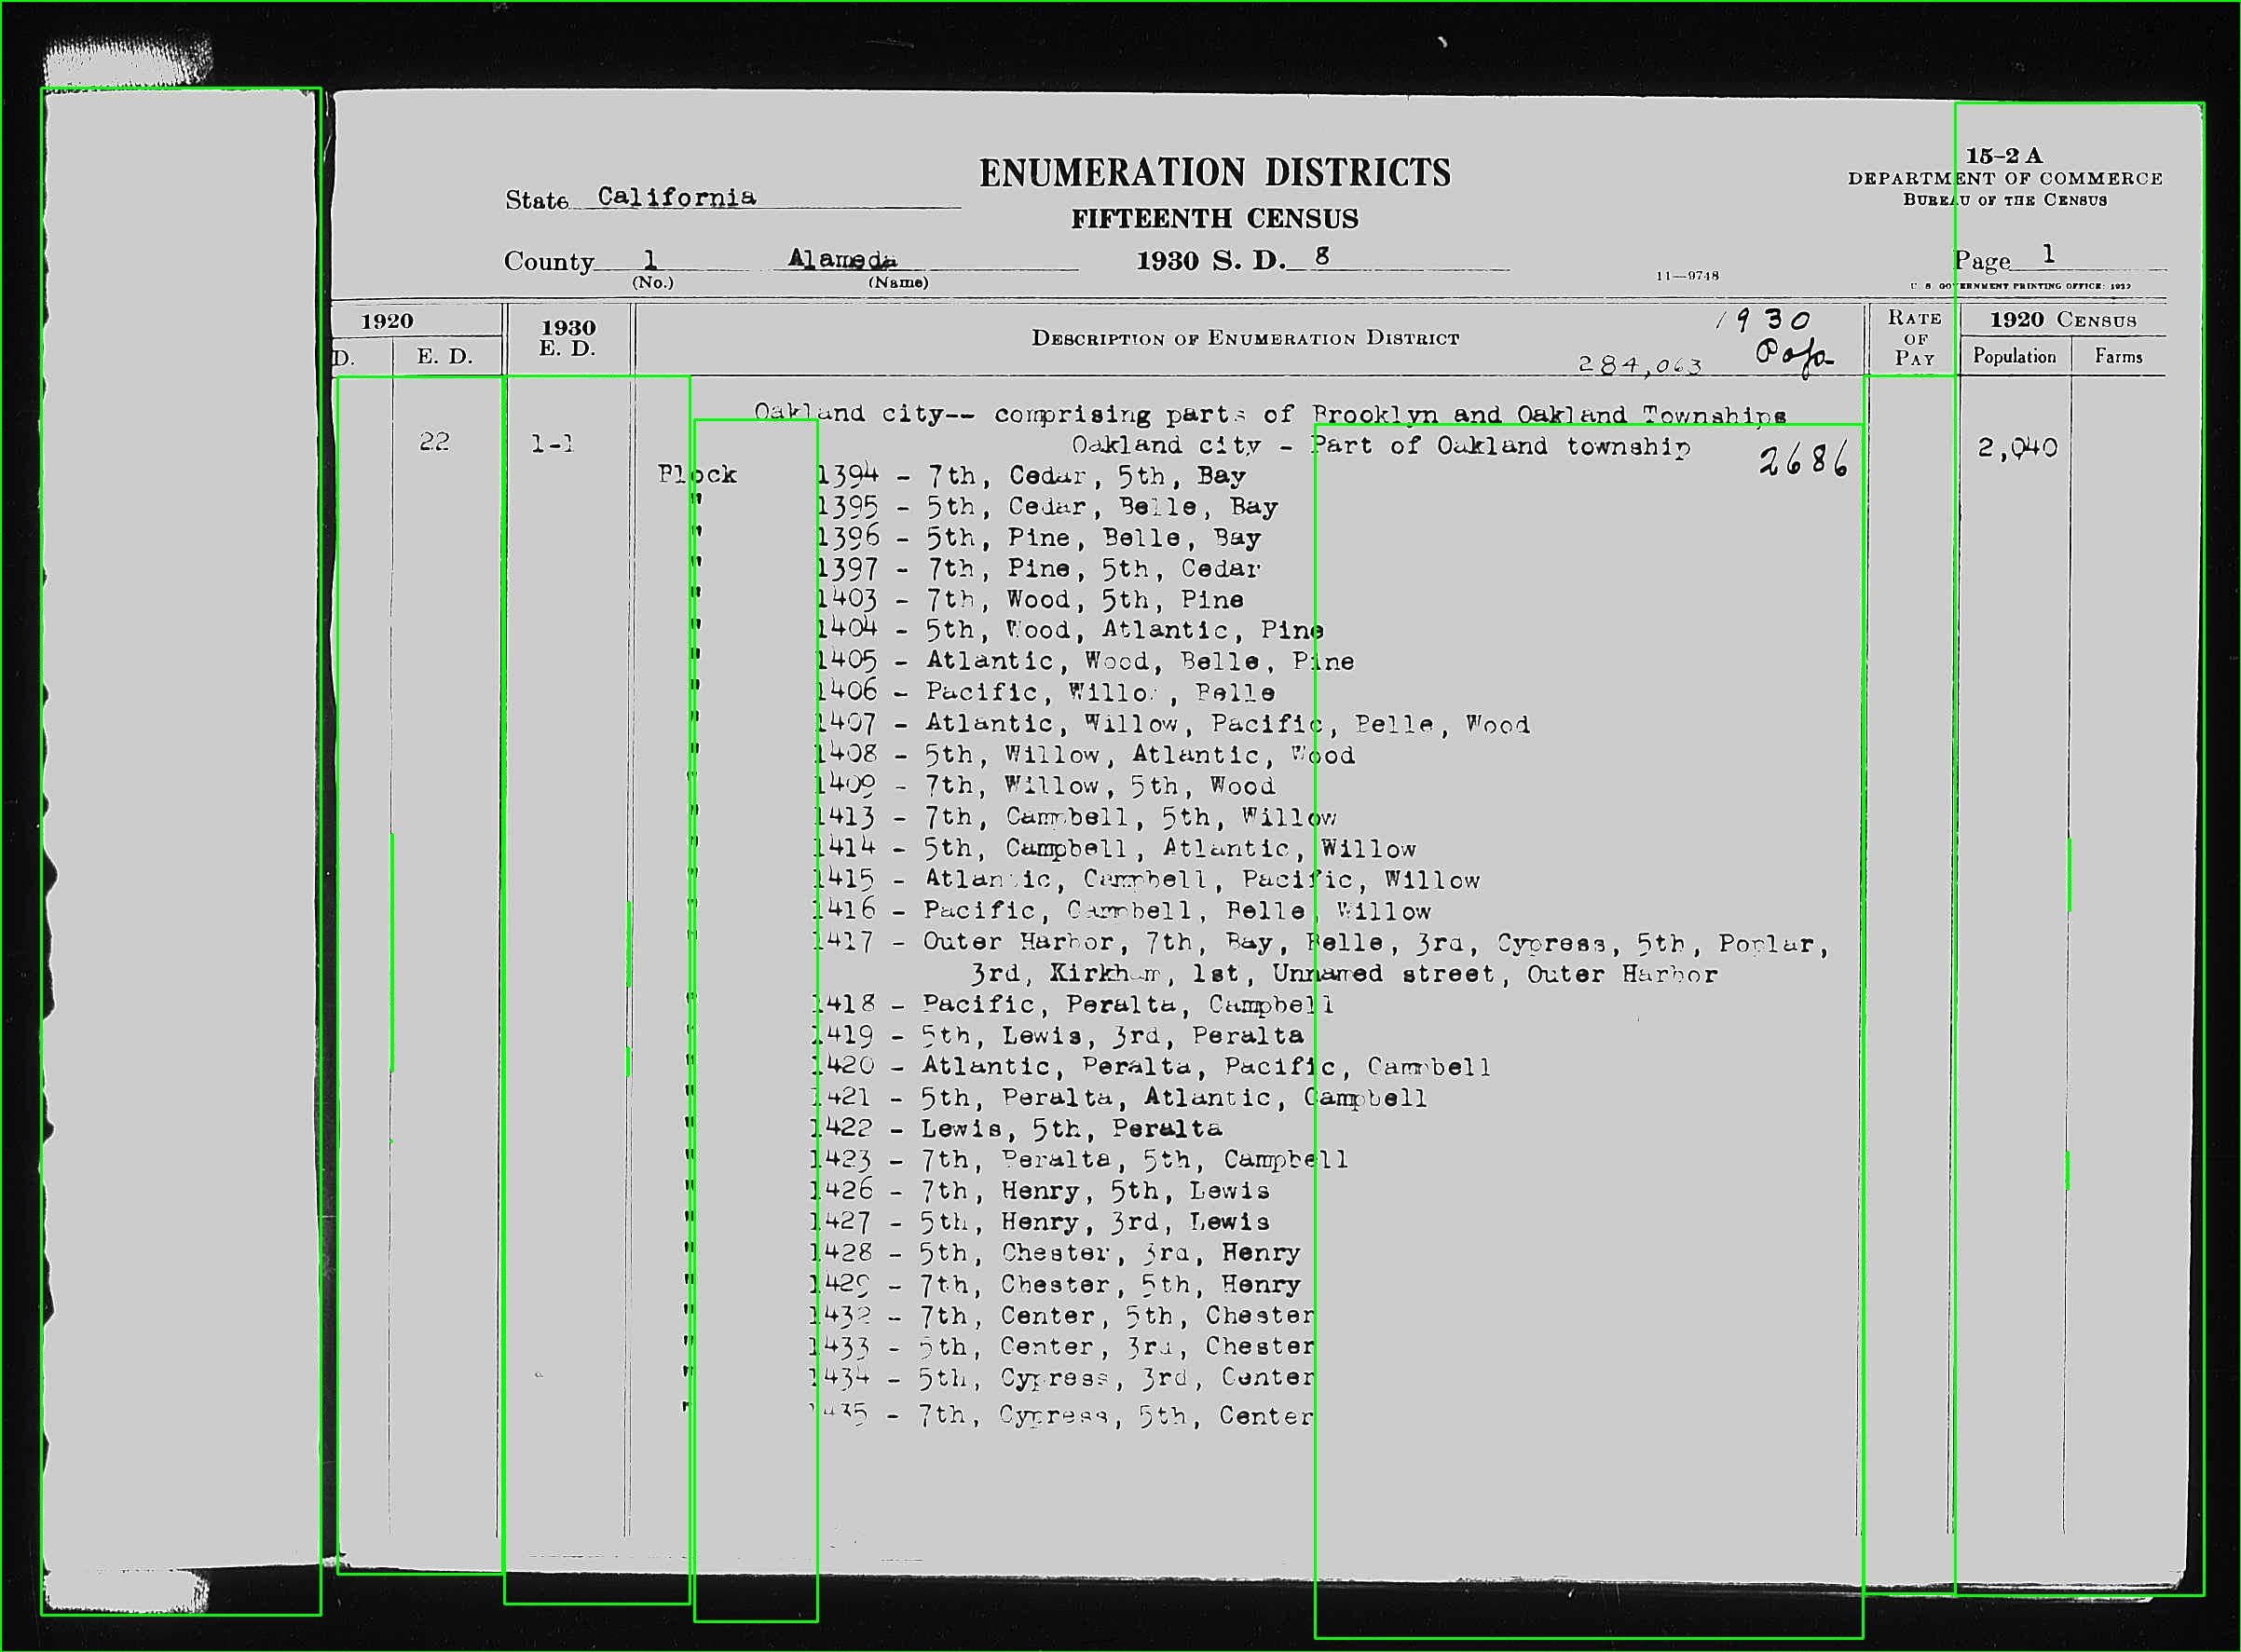
I have thousands of images that look like this:

enter image description here enter image description here enter image description here

I need to run an OCR algorithm on the "1930 E.D." column. I find that when I crop the image down to just that column, I get much better results from Tesseract. So I want to identify this long, vertical rectangle automatically and then crop the image and OCR just that bit (with a margin that I'll tweak).

However, the dimensions of the image and the location of the column aren't fixed. There can also be a small bit of rotation in the image which leads the vertical lines to be a few degrees off strictly vertical.

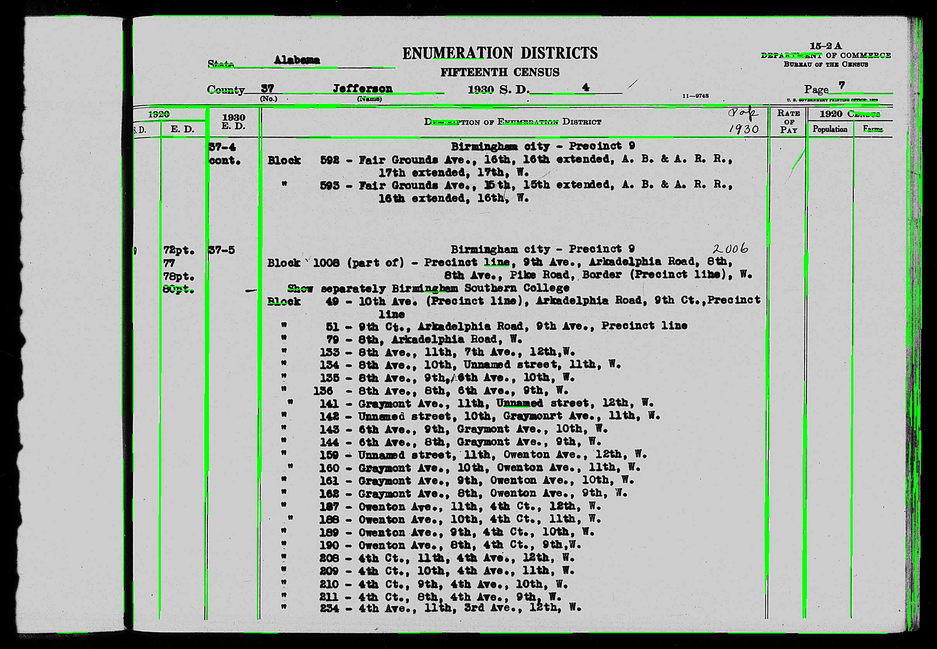
If I were able to reliably identify the long vertical and horizontal lines (and ideally be able to distinguish between single lines and line pairs), then I could easily find the column I need. But the images can be quite poor, so sometimes the lines are interrupted (see third test image). This is the closest I've come, based on this very helpful SO answer:

import cv2
import numpy as np

img = cv2.imread(path)
gray = cv2.cvtColor(img, cv2.COLOR_BGR2GRAY)
height, width, channels = img.shape

center_x = width // 2
center_y = height // 2
center_point = (center_x, center_y)

kernel_size = 5
blur_gray = cv2.GaussianBlur(gray, (kernel_size, kernel_size), 0)

low_threshold = 50
high_threshold = 150
edges = cv2.Canny(blur_gray, low_threshold, high_threshold)

rho = 1  # distance resolution in px of Hough grid
theta = np.pi / 180  # angular resolution in rad of Hough grid
threshold = 15  # minimum number of votes (intersections in Hough grid cell)
min_line_length = 50  # minimum number of px making up a line
max_line_gap = 5  # maximum gap in px btw line segments
line_image = np.copy(img) * 0  # creating a blank to draw lines on
lines = cv2.HoughLinesP(
    edges,
    rho,
    theta,
    threshold,
    np.array([]),
    min_line_length,
    max_line_gap,
)
for line in lines:
    for x1, y1, x2, y2 in line:
        cv2.line(img, (x1, y1), (x2, y2), (0, 255, 0), 2)

Which gives me an image like this:

enter image description here

This looks like it could be good enough line discovery. But my question is: how do I group the lines/countours and then determine the coordinates that define the crop rectangle?

Assuming accurate line discovery, a reliable heuristic will be that the rectangle in question will consist of the first two (double) lines to the left of the centerpoint of the image, with the top edge being the first (single) line above the center point. Putting the bottom edge at the end of the image should be fine: the OCR isn't going to identify any text in the black border area. Basically, every image shows the same paper form.

Thanks in advance!

UPDATE: I have tried @fmw42's suggested approach, and have made some progress! Here's the code as of now. Points to note:

  1. I've used equalizeHist to improve the contrast. This seems to marginally improve results.
  2. I'm relying on a morphology kernel of 400x30, which selects for tall, narrow boxes.
from pathlib import Path
import cv2
import numpy as np

def find_column(path):
    image = cv2.imread(path)
    out = cv2.imread(path)
    gray = cv2.cvtColor(image, cv2.COLOR_BGR2GRAY)
    equal = cv2.equalizeHist(gray)
    _, thresh = cv2.threshold(equal, 10, 255, cv2.THRESH_BINARY_INV)

    kernel = np.ones((400, 30), np.uint8)
    morph = cv2.morphologyEx(thresh, cv2.MORPH_CLOSE, kernel)
    contours, _ = cv2.findContours(morph, cv2.RETR_TREE, cv2.CHAIN_APPROX_SIMPLE)

    for contour in contours:
        x, y, w, h = cv2.boundingRect(contour)
        cv2.rectangle(out, (x, y), (x + w, y + h), (0, 255, 0), 2)

    cv2.imwrite(Path("/tmp") / path.name, out)  # Save
    show_img(path.stem, out)

def show_img(self, title, img):
    cv2.imshow(title, img)
    code = cv2.waitKeyEx(0)
    cv2.destroyAllWindows()

    if code == 113:  # 'q'
        sys.exit(0)

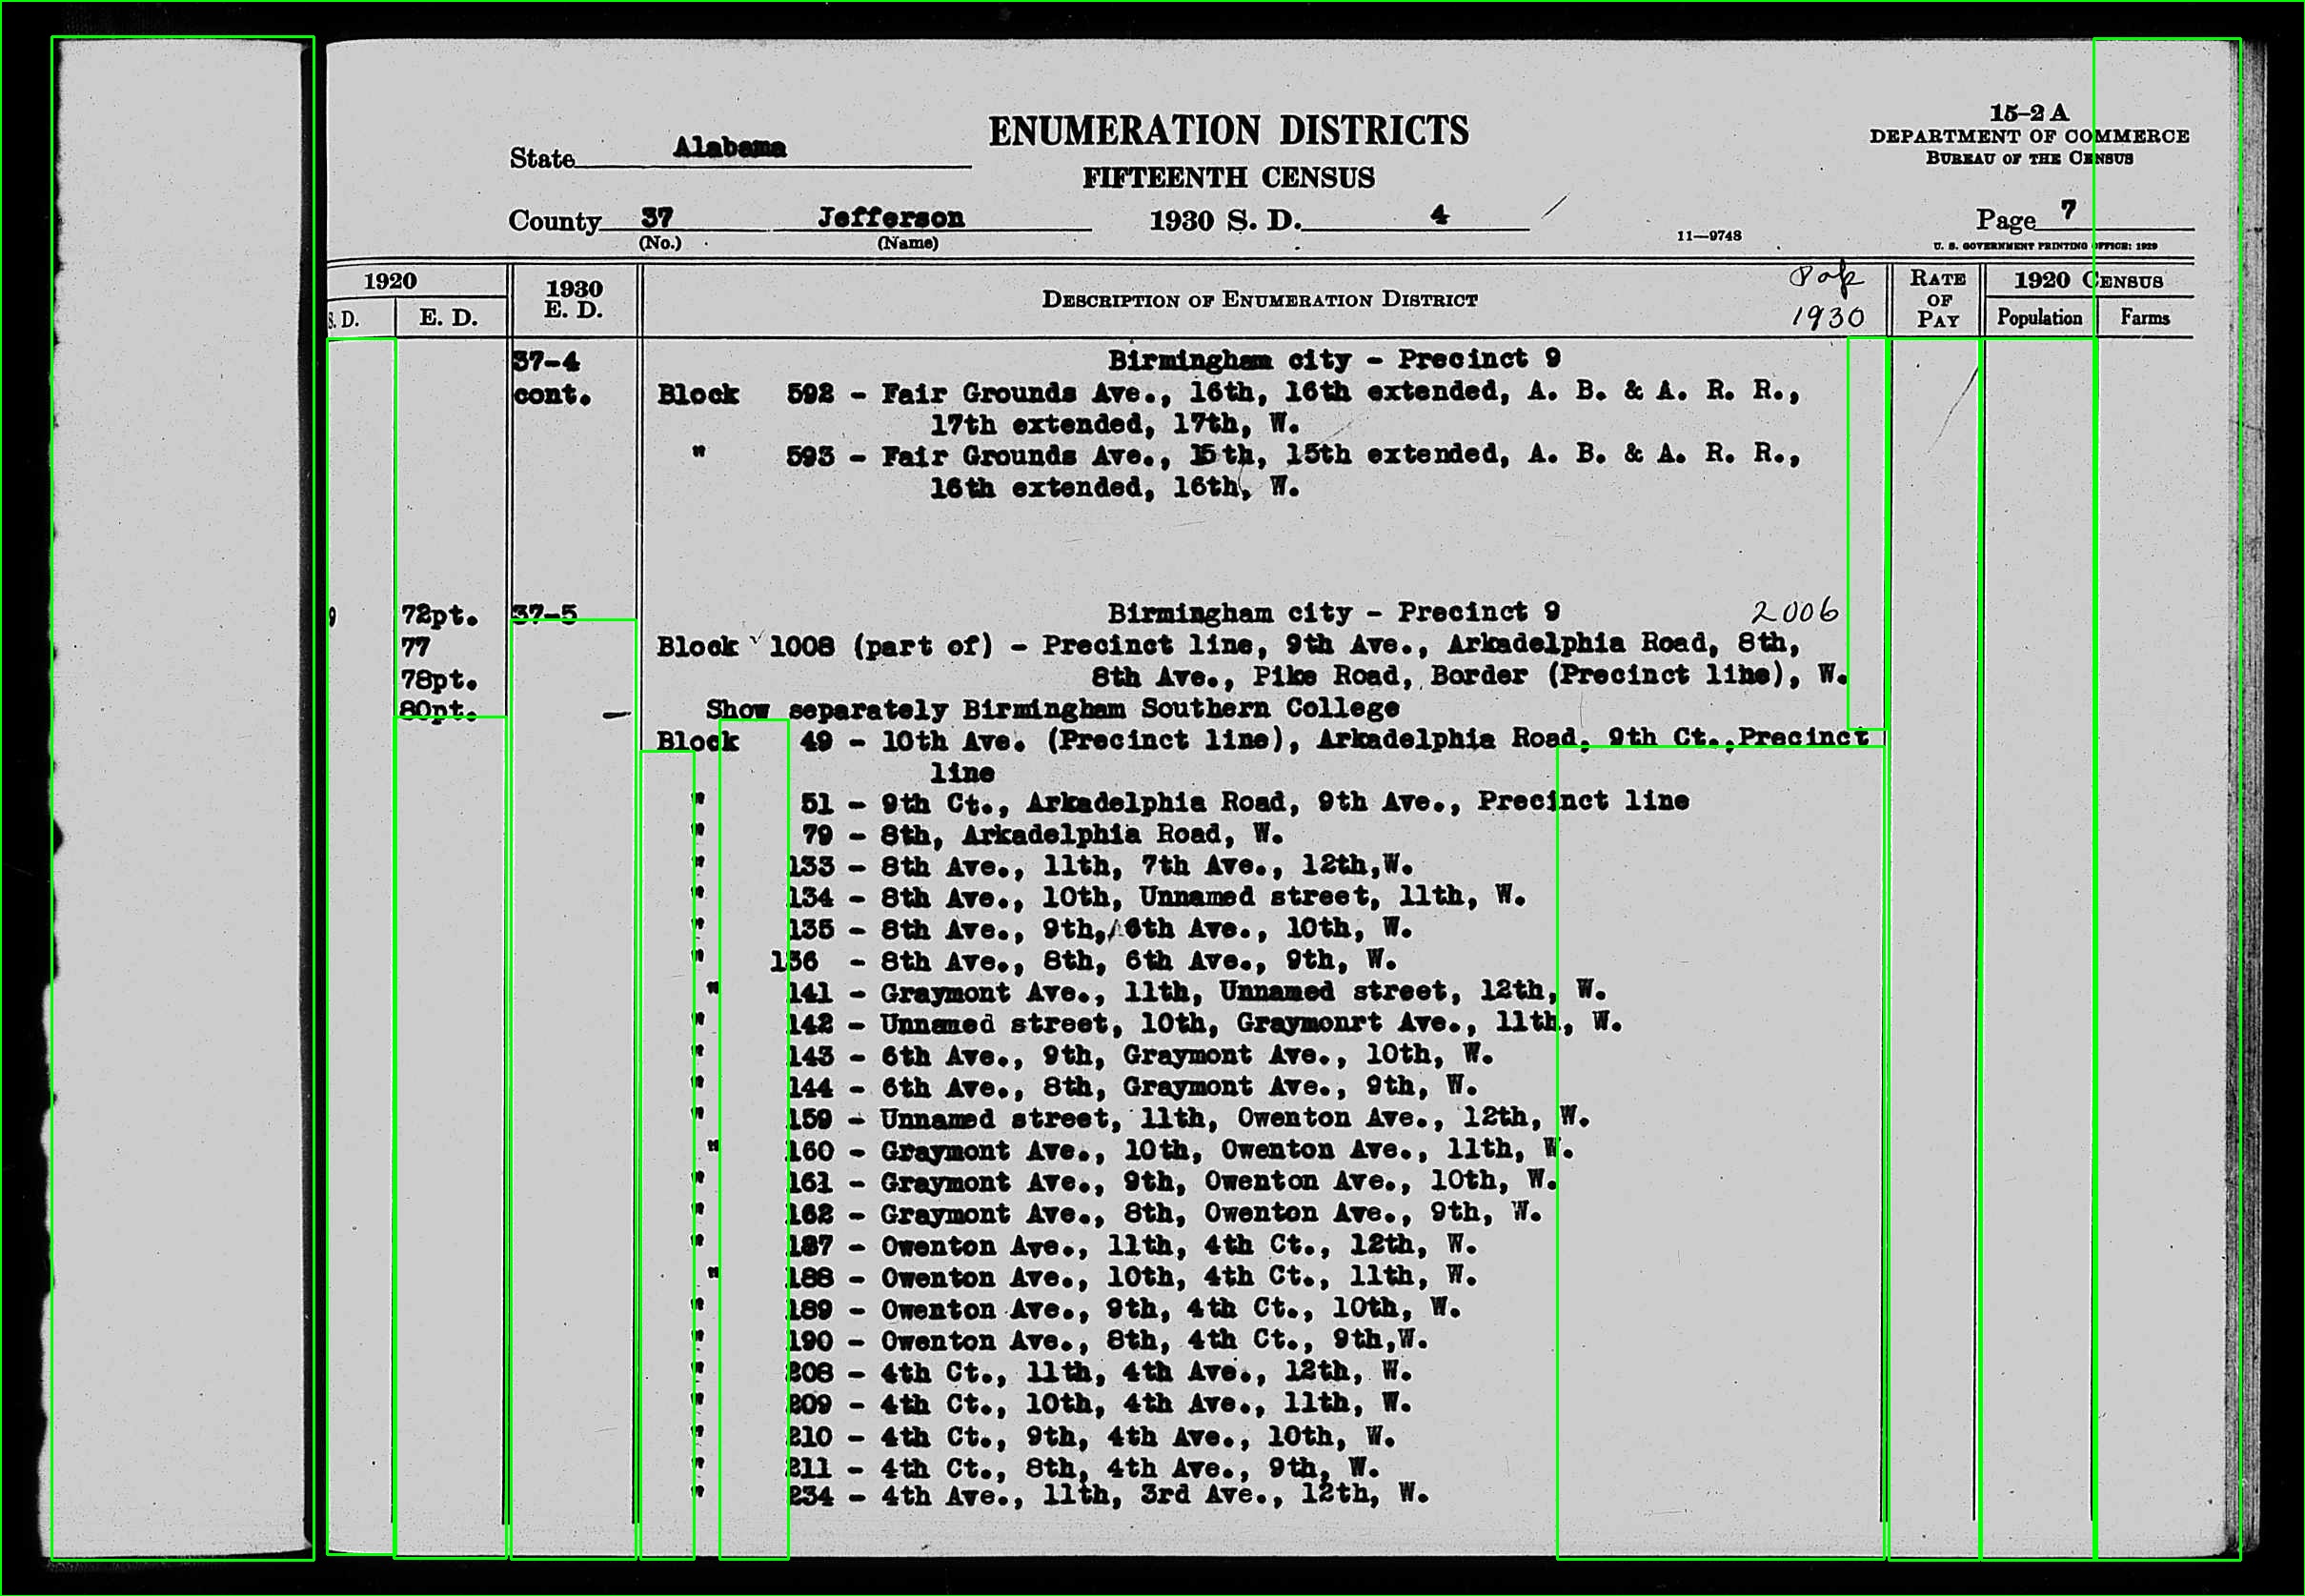
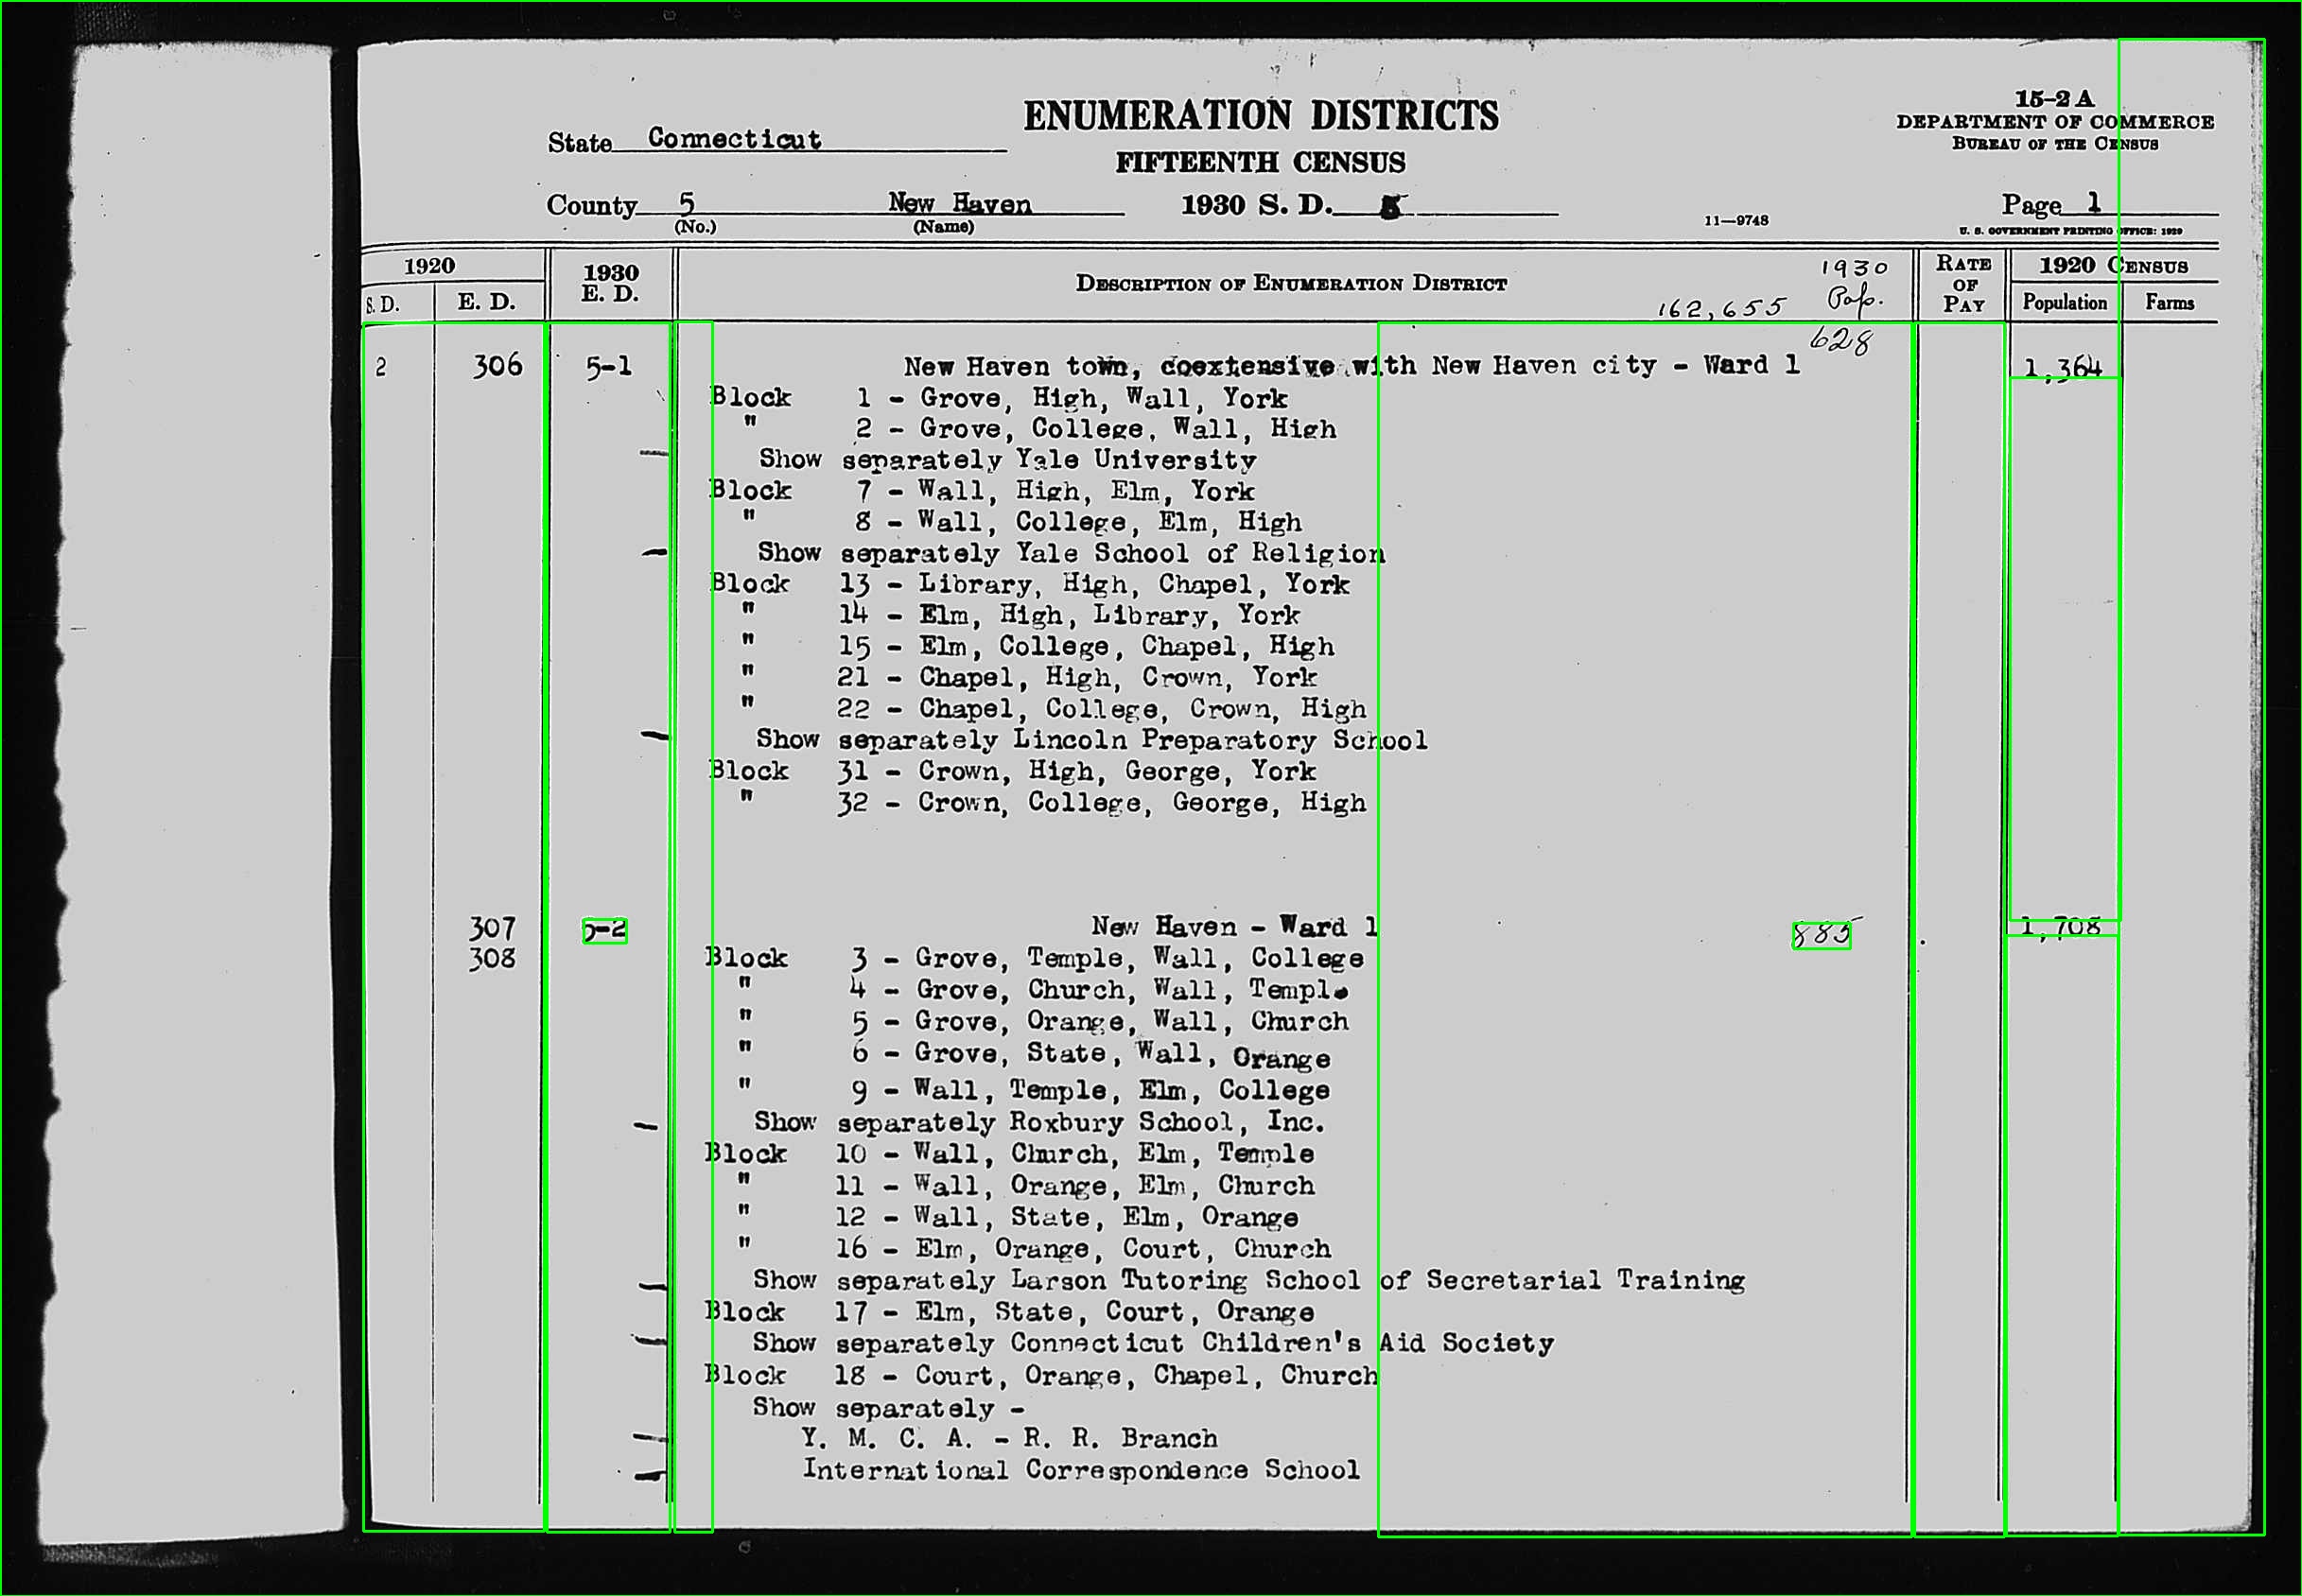
That results in this:

enter image description here enter image description here enter image description here enter image description here

This does work sometimes, and quite well in those cases. But more often, the box still isn't properly aligned or doesn't extend far enough up the column to capture all of the text. Any other suggestions about how to tweak these knobs to realiably get the coordinates of the column I'm after?

Irretrievable answered 18/7, 2024 at 21:40 Comment(4)
Use contours to get all boxes and filter as appropriate. Don't use canny or HoughLines. Convert to gray, threshold, use morphology to close lines, then get contours.Rigidify
On the situation that "This looks like it could be good enough line discovery" already found, why Canny+Hough should be avoided? If current Hough result distinguish "double line" as 2 individual lines, for example checking the voting result of Hough, "double line" may be able to be found easily. (I don't say "using OpenCV's Hough implementation is good", but I guess the alogorithm "Hough transform" can be one way in this case)Faina
Thanks both for your comments. I'm looking for a solution that takes the many contours in the green image above (or those of another approach like that proposed by @fmw42) and generates the coordinates of the column rectangle. Would appreciate any suggestions you can provide!Irretrievable
@fmw42, I have had some success with your suggestion, thank you! I've updated the question with new code/images. If you have any ideas on how to improve the results of this approach, I'm all ears.Irretrievable
H
1

This is kind of a static solution for now, but here's an easy but nice way to do it, as others suggested as well.

The box that contains "1930 E.D." is quite a nice feature to detect. Some key characteristics:

  • This box looks quite unique in its' aspect ratio and size. On closer inspection, we see that the width is around 133 pixels and the height around 77 pixels
  • That box is also always in the top left quadrant, so we can add more constraints on the detected contours

If we detect the contour and add a rectangle on it, we get the following image, for the first example:

With box

This is however still not enough to solve your problem. We continue by defining a region of interest.

The snippet so far looks something like this:

im = cv2.imread(file) # read image as BGR
imContoured = im.copy() # copy image for contouring
imGray = cv2.imread(file, 0) # read image as gray
imGray[imGray<205] = 0 # add contrast
imOTSU = cv2.threshold(imGray, 0, 255, cv2.THRESH_OTSU)[1] # apply otsu
contours, _ = cv2.findContours(imOTSU, cv2.RETR_TREE, cv2.CHAIN_APPROX_NONE) # find contours
imHeight, imWidth = imGray.shape # get dimensions of image
for c in contours: # for every contour
    x,y,w,h = cv2.boundingRect(c) # get bounding rectangle
    if (100<w<150 and 65<h<85 and y<imHeight//2 and x<imWidth//2): # check for constraints
        boxWidth = w # store w
        boxHeight = h # store h
        boxX = x # store x
        boxY = y # store y
        cv2.rectangle(imContoured, (x,y), (x+w,y+h), (0,0,255), 5) # add red rectangle

Now that we detected where this box should be, we can use the y+h value to get the start of the column you are interested in. Let's define our ROI as the bottom of the detected box and the whole width, with some padding:

padx = 15; pady = 10 # define padding
imROI = im.copy()[boxY+boxHeight-pady:imHeight,boxX-padx:boxX+boxWidth+padx,:] # get BGR ROI
imGrayROI = imGray[boxY+boxHeight-pady:imHeight,boxX-padx:boxX+boxWidth+padx] # get gray ROI

The padding is necessary, specially in the x direction, as the column is not straight. One thing that we still need is to automatically detect where the scan ends. For this, we can use the row-wise sum of imGrayROI:

rowSum = np.sum(imGrayROI, axis=1) # get row wise sum
pageEnd = np.nonzero(rowSum)[0]; pageEnd = pageEnd[-1] # find index of last non-zero (page end)
imGrayROI = imGrayROI[:pageEnd, :] # redefine the ROI
imROI = imROI[:pageEnd, :, :] # redefine the image

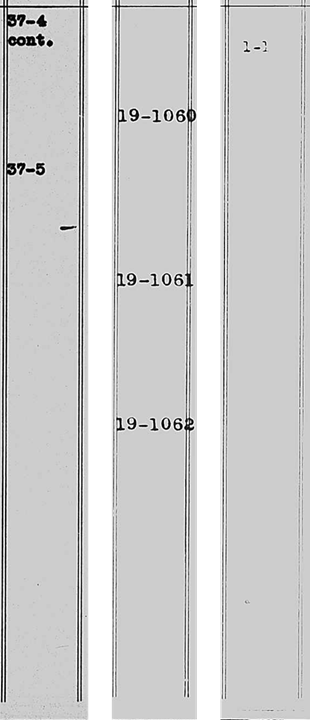
And like this you will get the column images, with a heavily contrasted imGrayROI and a BGR imROI. The three results are stitched in the following image:

1-2-3


Here are my imports:

%matplotlib notebook
import numpy as np
import cv2
import matplotlib.pyplot as plt
import os
files = os.listdir()

Note that I am using Jypter here. If you are not interested in this then just ignore the %matplotlib notebook.


Everything as a dump:

%matplotlib notebook
import numpy as np
import cv2
import matplotlib.pyplot as plt
from imutils.perspective import four_point_transform
import os
files = os.listdir()
padx = 15; pady = 10 # define padding
for file in files:
    if file.endswith("jpg"):
        im = cv2.imread(file) # read image as BGR
        imContoured = im.copy() # copy image for contouring
        imGray = cv2.imread(file, 0) # read image as gray
        imGray[imGray<205] = 0 # add contrast
        imOTSU = cv2.threshold(imGray, 0, 255, cv2.THRESH_OTSU)[1] # apply otsu
        contours, _ = cv2.findContours(imOTSU, cv2.RETR_TREE, cv2.CHAIN_APPROX_NONE) # find contours
        imHeight, imWidth = imGray.shape # get dimensions of image
        for c in contours: # for every contour
            x,y,w,h = cv2.boundingRect(c) # get bounding rectangle
            if (100<w<150 and 65<h<85 and y<imHeight//2 and x<imWidth//2): # check for constraints
                boxWidth = w # store w
                boxHeight = h # store h
                boxX = x # store x
                boxY = y # store y
                cv2.rectangle(imContoured, (x,y), (x+w,y+h), (0,0,255), 5) # add red rectangle
                imROI = im.copy()[boxY+boxHeight-pady:imHeight,boxX-padx:boxX+boxWidth+padx,:] # get BGR ROI
                imGrayROI = imGray[boxY+boxHeight-pady:imHeight,boxX-padx:boxX+boxWidth+padx] # get gray ROI
                rowSum = np.sum(imGrayROI, axis=1) # get row wise sum
                pageEnd = np.nonzero(rowSum)[0]; pageEnd = pageEnd[-1] # find index of last non-zero (page end)
                imGrayROI = imGrayROI[:pageEnd, :] # redefine the ROI
                imROI = imROI[:pageEnd, :, :] # redefine the image
                break
        fileSplitted = file.split(".") # split file for naming
        cv2.imwrite(fileSplitted[0]+"_processed.png", imContoured) # save image
        cv2.imwrite(fileSplitted[0]+"_column.png", imROI) # save image

Some note: I would have liked to use from imutils.perspective import four_point_transform to improve the results of the OCR. This ended up a bit tedious since I could not accuretly get the corners. Maybe I'll take a look at it some other time.

My code does not check the quality of the pytesseract. I assume some resizing might be needed here. For the second image, the numbers overlap with the vertical lines, this might lead to some problems as well. Maybe consider a filter.

Hoskins answered 12/8, 2024 at 14:44 Comment(0)

© 2022 - 2025 — McMap. All rights reserved.