I'm new to Gatling, apologies if this is a complete noob question.
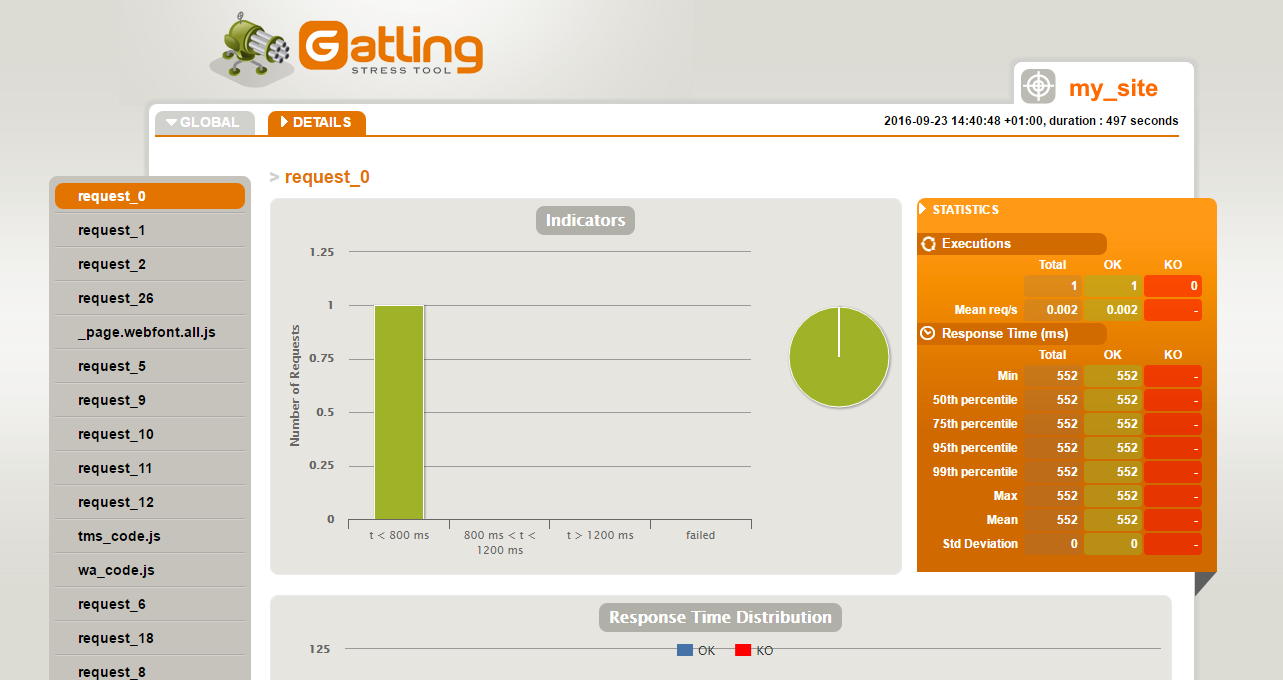
The "Details" tab of my Gatling report looks like this:
The left-hand menu contains all the requests that were made. My problem is that, in all but a few rare cases, they're just labelled "request_x" instead of the URL or filename. So where there is a bottleneck I can't tell what page or resource was causing it.
I found that if I manually edit the .scala file before running the scan, I can change each one by hand, e.g. if I change...
    .exec(http("request_0")
        .get(uri01)
        .headers(headers_0)
        .resources(http("request_1")
        .get(uri02)
        .headers(headers_1)))
...to..
    .exec(http(uri01)
        .get(uri01)
        .headers(headers_0)
        .resources(http(uri02)
        .get(uri02)
        .headers(headers_1)))
...it seems to have the desired effect. But I don't want to have to change hundreds of these by hand every time I have a new test to run.
Surely there's a better way?
FWIW I'm generating this scala file using Gatling's "recorder" with an HAR file exported from Chrome, as opposed to running the recorder as a proxy. But I have tried the proxy option and got the same end result.

