Connected components on Pandas DataFrame with Networkx
Asked Answered
B

1

10

Action To cluster points based on distance and label using connected components.

Problem The back and forth switching between NetworkX nodes storage of attributes and Pandas DataFrame

  • Seems too complex
  • Index/key errors when looking up nodes

Tried Using different functions like Scikit NearestNeighbours, however resulting in the same back and forth moving of data.

Question Is there a simpler way to perform this connected components operation?

Example

import numpy as np
import pandas as pd
import dask.dataframe as dd
import networkx as nx
from scipy import spatial

#generate example dataframe
pdf = pd.DataFrame({'x':[1.0,2.0,3.0,4.0,5.0],
                    'y':[1.0,2.0,3.0,4.0,5.0], 
                    'z':[1.0,2.0,3.0,4.0,5.0], 
                    'label':[1,2,1,2,1]}, 
                   index=[1, 2, 3, 4, 5])
df = dd.from_pandas(pdf, npartitions = 2)

object_id = 0
def cluster(df, object_id=object_id):
    # create kdtree
    tree = spatial.cKDTree(df[['x', 'y', 'z']])

    # get neighbours within distance for every point, store in dataframe as edges
    edges = pd.DataFrame({'src':[], 'tgt':[]}, dtype=int)
    for source, target in enumerate(tree.query_ball_tree(tree, r=2)):
        target.remove(source)
        if target:
            edges = edges.append(pd.DataFrame({'src':[source] * len(target), 'tgt':target}), ignore_index=True)

    # create graph for points using edges from Balltree query
    G = nx.from_pandas_dataframe(edges, 'src', 'tgt')

    for i in sorted(G.nodes()):
        G.node[i]['label'] = nodes.label[i]
        G.node[i]['x'] = nodes.x[i]
        G.node[i]['y'] = nodes.y[i]
        G.node[i]['z'] = nodes.z[i]

    # remove edges between points of different classes
    G.remove_edges_from([(u,v) for (u,v) in G.edges_iter() if G.node[u]['label'] != G.node[v]['label']])

    # find connected components, create dataframe and assign object id
    components = list(nx.connected_component_subgraphs(G))
    df_objects = pd.DataFrame()

    for c in components:
        df_object = pd.DataFrame([[i[0], i[1]['x'], i[1]['y'], i[1]['z'], i[1]['label']] for i in c.nodes(data=True)]
                                 , columns=['point_id', 'x', 'y', 'z', 'label']).set_index('point_id')
        df_object['object_id'] = object_id
        df_objects.append(df_object)
        object_id += 1

    return df_objects

meta = pd.DataFrame(np.empty(0, dtype=[('x',float),('y',float),('z',float), ('label',int), ('object_id', int)]))
df.apply(cluster, axis=1, meta=meta).head(10)
Belton answered 22/11, 2017 at 15:37 Comment(3)
Hello! Sorry for the lack of answers to this question. If you found a good solution on your own in the mean time, feel free to post it as an answer to your own question as it might help others with the same problem in the future.Bessie
Thanks for your message, I sadly have not found a more efficient way to go about this since asking this question. I worked with the solution as provided in my example at the time.Belton
I am getting ValueError: data must be 2 dimensions while trying to run your code.Border
O
2

You can use DBSCAN from scikit-learn. For min_samples=1 it basically finds connected components. It can use different algorithms for nearest neighbors computation and is configured through the parameter algorithm (kd-tree is one of the options).

My other suggestion is to do the computation separately for different labels. This simplifies the implementation and allows for parallelization.

These two suggestions can be implemented as follows:

from sklearn.cluster import DBSCAN

def add_cluster(df, distance):
    db = DBSCAN(eps=distance, min_samples=1).fit(df[["x", "y", ...]])
    return df.assign(cluster=db.labels_)

df = df.groupby("label", group_keys=False).apply(add_cluster, distance)

It should work for both Pandas and Dask dataframes. Note that the cluster-id starts from 0 for each label, i.e. a cluster is uniquely identified by the tuple (label, cluster).

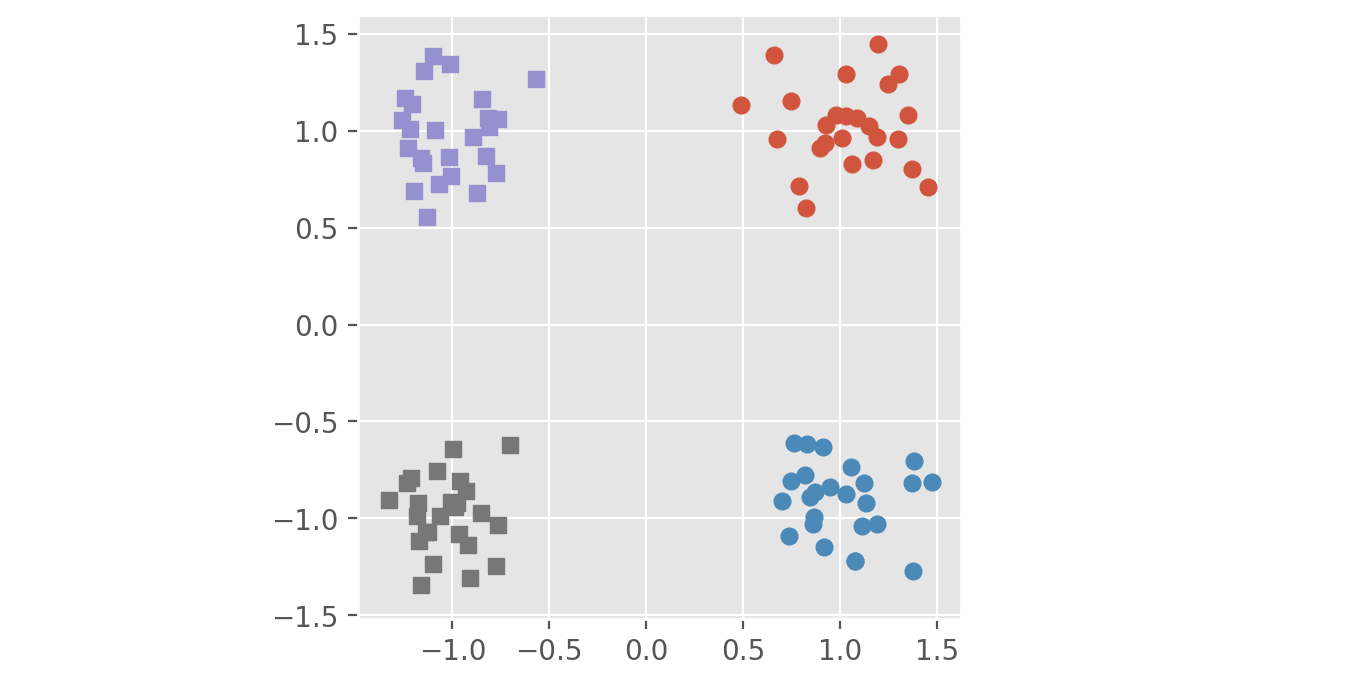
Here is a complete example with artificial data:

import numpy as np
import pandas as pd
import matplotlib.pyplot as plt
from sklearn.datasets import make_blobs
from sklearn.cluster import DBSCAN

plt.rc("figure", dpi=100)
plt.style.use("ggplot")

# create fake data
centers = [[1, 1], [-1, -1], [1, -1], [-1, 1]]
XY, labels = make_blobs(n_samples=100, centers=centers, cluster_std=0.2, random_state=0)
inp = (
    pd.DataFrame(XY, columns=["x", "y"])
    .assign(label=labels)
    .replace({"label": {2: 0, 3: 1}})
)

def add_cluster(df, distance):
    db = DBSCAN(eps=distance, min_samples=1).fit(df[["x", "y"]])
    return df.assign(cluster=db.labels_)

out = inp.groupby("label", group_keys=False).apply(add_cluster, 0.5)

# visualize
label_marker = ["o", "s"]
ax = plt.gca()
ax.set_aspect('equal')

for (label, cluster), group in out.groupby(["label", "cluster"]):
    plt.scatter(group.x, group.y, marker=label_marker[label])

The resulting dataframe looks like this: enter image description here

The plot of the clusters looks as follows. Labels are indicated by the marker shape and clusters by the color. enter image description here

Onfre answered 13/6, 2021 at 10:47 Comment(0)

© 2022 - 2024 — McMap. All rights reserved.