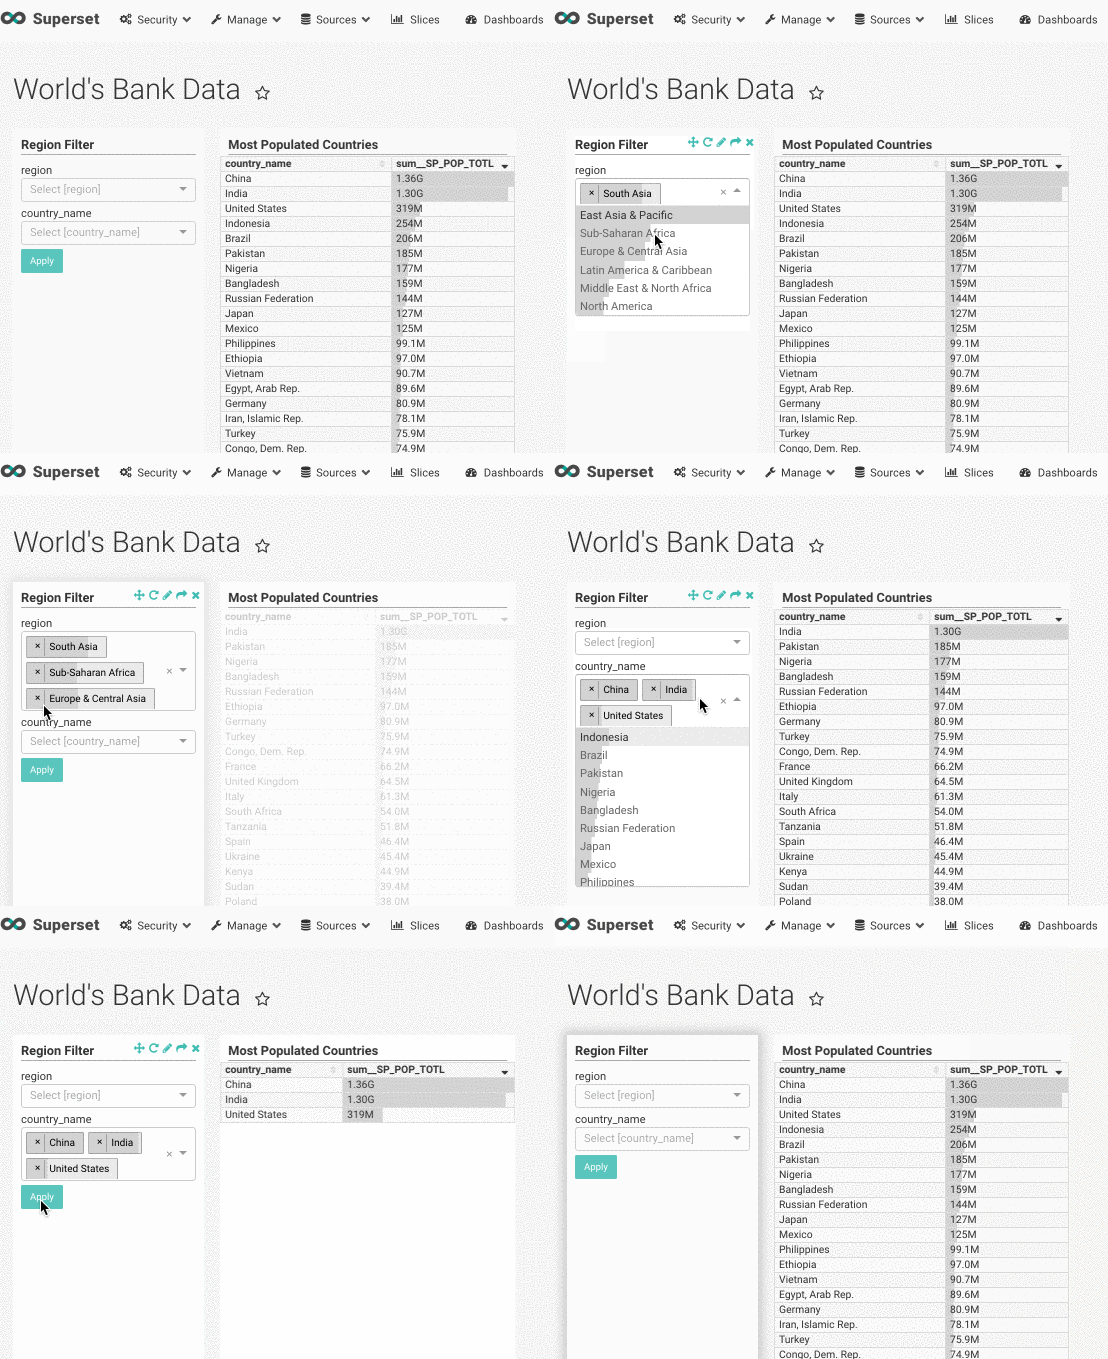
Superset comes with an example named "World's Bank Data". In its dashboard, there is a filter named "Region Filter". How can I implement this? Is there a tutorial on this? Any pointer or a quick explanation will be greatly appreciated.
The old approach was to create a "filter box" slice. It was announced in 2022 (with version 1.5) that this approach is being deprecated in favor of dashboard native filters.
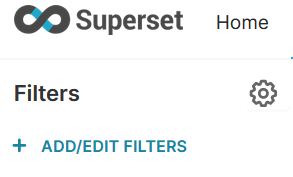
As of version >=1.5.0 you add a dashboard native filter by clicking +ADD/EDIT FILTERS in the top left of the dashboard:
This filter panel can be collapsed, so you may need to click the expand arrow if it is hidden.
In Superset versions >= 2.1.0, the filter panel can be moved to the top of the dashboard in a horizontal layout if the feature flag HORIZONTAL_FILTER_BAR is enabled.
Use superset jinja templating, example:
({{ "'" + "','".join(filter_values('platform')) + "'" }})
create a new chart and select the "filter box" and then add this to your dashboard
© 2022 - 2024 — McMap. All rights reserved.


