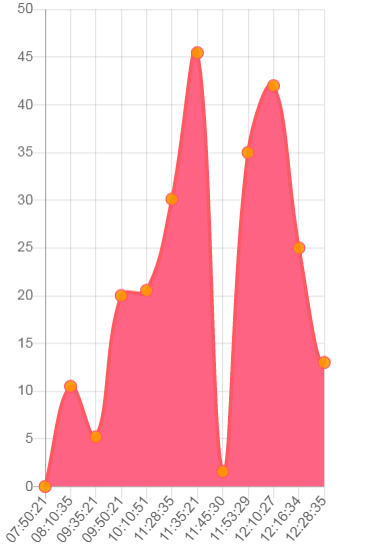
I'm trying to use chart.js to create thumbnails which will link to pages with the full chart.
The full chart on the linked page looks good but the for the thumbnail I just can't get the sizing right. The canvas is covering the right area but the graph doesn't fill it vertically.
var data = {
    labels: ['','','','','','','','','',''],
    datasets: [{
        data:[22,25,23,24,25,22,25,23,24,25],
            backgroundColor: "rgba(54, 255, 170, 0.4)",
            borderColor: "rgba(54, 255, 170, 1)",
            orderWidth: 1,
    }]
};
var options = {
    tooltips: false,
    legend: {
        display:false
    },
    scales: {
        yAxes: [{
            display:false,
            ticks: {
                beginAtZero:true
            }
        }],
        xAxes: [{
            gridLines: {
                color: "rgba(0, 0, 0, 0)",
            }
        }]
    }
};

new Chart($("#chart-"+this.model.id), {
    type: 'bar',
    data: data,
    options: options
});
I've tried things like adjusting the min-height of the canvas but that causes the bars to blur. Is there any way I can adjust the height of the bars to occupy the whole canvas?


