How to annotate text along curved lines
Asked Answered
A

3

10

I am trying to annotate text in plots so that they follow the curvature of the line. I have the following plot:

enter image description here

And this is what I want to obtain, if I fix a particular y value for the annotation, for each curve it should place the annotation along the curve at the required slope (i.e. it should follow the curvature of the curve) as shown below:

enter image description here

The reproducible code for the plot without annotations is:

import numpy as np
import matplotlib.pyplot as plt

x = np.array([[53.4, 57.6, 65.6, 72.9],
            [60.8, 66.5, 73.1, 83.3],
            [72.8, 80.3, 87.2, 99.3],
            [90.2, 99.7, 109.1, 121.9],
            [113.6, 125.6, 139.8, 152]])

y = np.array([[5.7, 6.4, 7.2, 7.8],
            [5.9, 6.5, 7.2, 7.9],
            [6.0, 6.7, 7.3, 8.0],
            [6.3, 7.0, 7.6, 8.2],
            [6.7, 7.5, 8.2, 8.7]])

plt.figure(figsize=(5.15, 5.15))
plt.subplot(111)
for i in range(len(x)):
    plt.plot(x[i, :] ,y[i, :])
plt.xlabel('X')
plt.ylabel('Y')
plt.show()

How to place such texts in Python with matplotlib?

Arteaga answered 21/4, 2015 at 7:14 Comment(0)
A
5

You can get the gradient in degrees and use that in matplotlib.text.Text with the rotate argument

rotn = np.degrees(np.arctan2(y[:,1:]-y[:,:-1], x[:,1:]-x[:,:-1]))

EDIT: so it's a bit messier than I suggested as the plot area is scaled to match data and has margins etc. but you get the idea

...
plt.figure(figsize=(7.15, 5.15)) #NB I've changed the x size to check it didn't distort
plt.subplot(111)
for i in range(len(x)):
    plt.plot(x[i, :] ,y[i, :])

rng = plt.axis()
x_scale = 7.15 * 0.78 / (rng[1] - rng[0])         
y_scale = 5.15 * 0.80 / (rng[3] - rng[2])          
rotn = np.degrees(np.arctan2((y[:,1:]-y[:,:-1]) * y_scale,
                              x[:,1:]-x[:,:-1]) * x_scale)
labls = ['first', 'second', 'third', 'fourth', 'fifth']
for i in range(len(x)):
    plt.annotate(labls[i], xy=(x[i,2], y[i,2]), rotation=rotn[i,2])

plt.xlabel('X')

RE-EDIT noticed that the scaling was wrong but just happened to work by coincidence! Also the xy values of labels are a little approximate because of scaling.

Amphimacer answered 21/4, 2015 at 8:56 Comment(3)
How did you get the values 7.15, 5.15, and 1.5?Arteaga
good point. My parsimony with copy pasting the code I tested! I will now re-edit to add the missing bit. The subtraction of 1.5 is an approximation to get the actual graph area. There is probably a method in matplotlib that does it for you. Alternatively it might use proportion in which case you could * 0.7 or whateverAmphimacer
PS just checked matplotlib and the subplot seems to have margins 0.12l, 0.9r, 0.1b, 0.9t and using 7.15*0.78 and 5.15*0.8 seems to work pretty wellAmphimacer
H
1

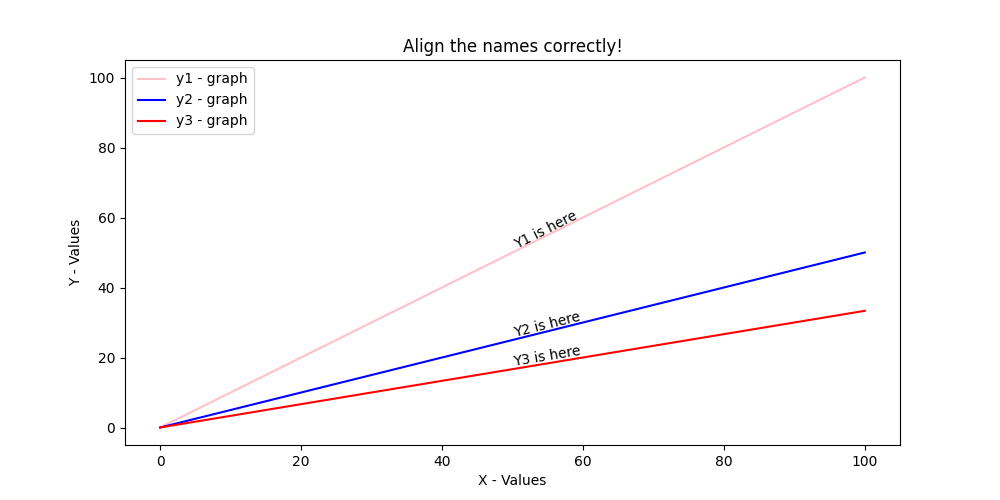
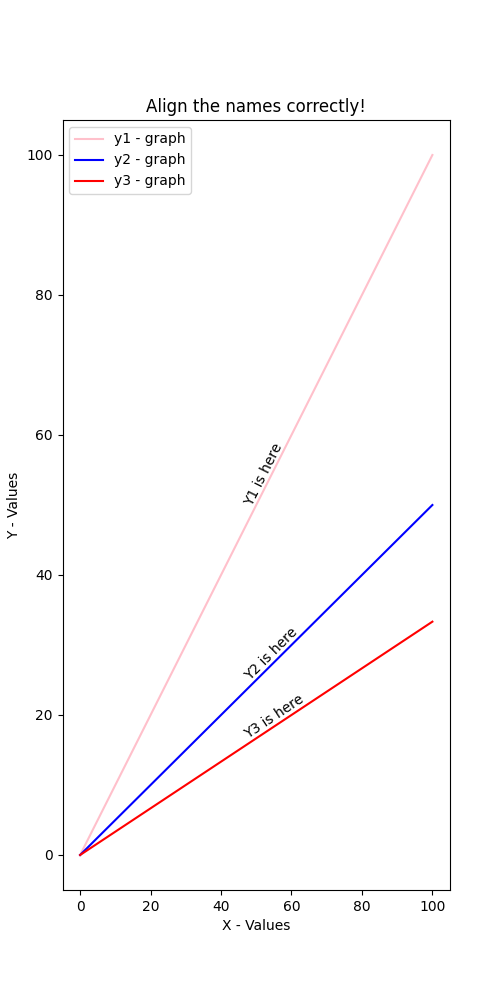
Sorry for the typos ..(if any) Here is my answer... It is a slight tweak of @paddyg's answer, and yes, the resizing the chart with the mouse upon display will cause aligment issues.

You will have to tweak the offset and the chart dimensions

Outputs:

Image 1 has window size(10,5),offset(0,1)

Image 2 has window size(10,5),offset(-4,0)

Output image for window size:(10,5)

Output image for window size:(5,10)

import matplotlib.pyplot as plt
import math

# I've used 3 plots here:
x_range = [i for i in range(0,101)]
y1_range = [i/1 for i in range(0,101)]
y2_range = [i/2 for i in range(0,101)]
y3_range = [i/3 for i in range(0,101)]

# Size of the ouput figure
x_fig = 10
y_fig = 5
plt.figure(figsize=(x_fig, y_fig))
# The height offset form the midpoint of the line segments
offset = [0,1]

def angle(rng,point,x_fig,y_fig):
    '''
    This will return the alignment angle
    '''
    # print("rng = ", rng)
    x_scale = x_fig /(rng[1] - rng[0])
    y_scale = y_fig /(rng[3] - rng[2])
    assert len(point) == 2, 'point is not properly defined'
    x = point[0]
    y = point[1]
    rot = ((math.atan2( y*y_scale , x*x_scale ))*180)/math.pi
    print(rot,point)
    return rot

def center_point(start,end,height_offset):
    '''
    This will return the location of text placement
    '''
    x_mid = (end[0]-start[0])/2
    y_mid = (end[1]-start[1])/2
    return[x_mid+height_offset[0],y_mid+height_offset[1]]

# Plotting graphs...
plt.plot(x_range,y1_range,color='pink',label = 'y1 - graph')
plt.plot(x_range,y2_range,color='blue',label = 'y2 - graph')
plt.plot(x_range,y3_range,color='red',label =  'y3 - graph')

rng = plt.axis() # This gives the axes range
rot_y1 = angle(rng,[x_range[-1],y1_range[-1]],x_fig,y_fig)
pos_y1 = center_point([x_range[0],y1_range[0]],[x_range[-1],y1_range[-1]],offset)

rot_y2 = angle(rng,[x_range[-1],y2_range[-1]],x_fig,y_fig)
pos_y2 = center_point([x_range[0],y2_range[0]],[x_range[-1],y2_range[-1]],offset)

rot_y3 = angle(rng,[x_range[-1],y3_range[-1]],x_fig,y_fig)
pos_y3 = center_point([x_range[0],y3_range[0]],[x_range[-1],y3_range[-1]],offset)

# Annotating them...(Of course this can be done in a loop as @paddyg's answer suggets.)
plt.annotate('Y1 is here', xy =(0, 0),
                xytext =(pos_y1[0], pos_y1[1]), 
                rotation=rot_y1)
plt.annotate('Y2 is here', xy =(0, 0),
                xytext =(pos_y2[0], pos_y2[1]), 
                rotation=rot_y2)
plt.annotate('Y3 is here', xy =(0, 0),
                xytext =(pos_y3[0], pos_y3[1]),
                rotation=rot_y3)


plt.legend()
plt.xlabel('X - Values')
plt.ylabel('Y - Values')
plt.title('Align the names correctly!')


plt.savefig('demo.png', transparent=True) # Do you want to save a backgroundless .png of the graph?
plt.show()
Hamlin answered 8/9, 2021 at 1:53 Comment(0)
A
1

Another tweak on the other answers: this time the angle is calculated using the physical dimension of the axes, so that this solution works in subplots within a larger figure.

Found this tip here.

import matplotlib.pyplot as plt
import numpy as np

# >> Curve to plot
x = np.linspace(0, 10, 100)
y = np.sin(x)

xlim = (0, 10)
ylim = (-2, 2)

idx = 30 # x index to plot the text at
npts = 10 # number of points away from idx to compute slope

# >> Build figure
fig, ax = plt.subplots(figsize=(5, 3))
ax.set_xlabel('x')
ax.set_ylabel('y')
ax.set_title('Text along the curve')

ax.set_xlim(xlim) # defining xlim, ylim will make it consistent
ax.set_ylim(ylim) #  as axes limits can change when plot happens

ax.plot(x, y)

# >> Compute angle for text
# --> get width and height of axes in physical units (pts)
bbox = ax.get_window_extent().transformed(fig.dpi_scale_trans.inverted())
width, height = bbox.width, bbox.height

# --> compute scaling from data units to physical units
scale_x = width / (xlim[1] - xlim[0])
scale_y = height / (ylim[1] - ylim[0])

# --> compute and plot angle
angle_rad = np.arctan2((y[idx+npts] - y[idx-npts])*scale_y, 
                       (x[idx+npts] - x[idx-npts])*scale_x)
angle = np.degrees(angle_rad)

ax.text(x[idx], y[idx], 'My text', ha='center', va='center', rotation=angle,
        bbox=dict(facecolor="white", edgecolor="None", alpha=0.8), 
        c='C0')

plt.tight_layout()
plt.show()

The plot it generates

If you don't want to set the axes limits, just plot the text in the end so that the limits do not change, and grab them using xlim = ax.get_xlim() (resp. ylim).

There's a bit of tweaking involved if the slope of the curve changes around where you want to plot your text: you can use npts to decide how far from the text the points used to compute the slope should be taken. When npts corresponds to approximately the half-width of your text, its rotation along the slope should look just right!

Archway answered 18/2, 2022 at 19:19 Comment(0)

© 2022 - 2024 — McMap. All rights reserved.