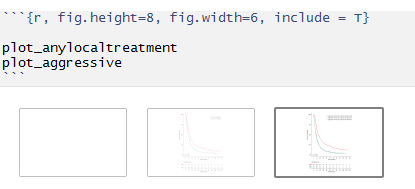
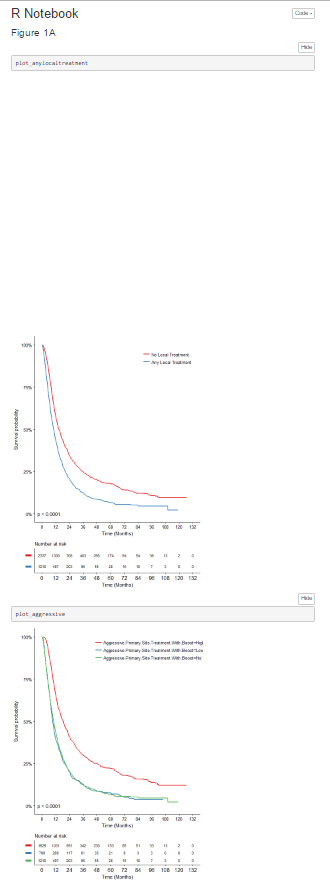
I'm currently having an issue with blank plots appearing in rmarkdown chunk outputs for survminer. Please see image below.
It makes output difficult as it includes a huge empty space while trying to author reports.
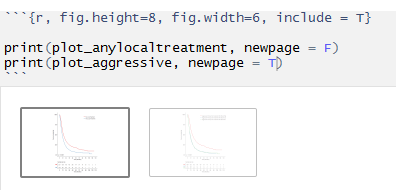
I've been investigating this issue and I've narrowed it down to having to do with this print 'newpage' argument -
My question is - can anybody explain what exactly is happening here? - why is there a 'blank' plot and how can I not have it show ? - what exactly is happening when I have newpage = F for the first plot and newpage = T for the second plot to not have the blank page show ? - is there any other method of NOT having the first blank plot show ?
Thank you!
EDIT:
Reproducible Example -
require(survminer)
require(survival)

Data <- data.frame(
X = sample(1:30),
Y = sample(c(1,0), 30, replace = TRUE),
Z = sample(c(1,0), 30, replace = TRUE)
)

ggsurvplot(
 survfit(Surv(Data$X, Data$Y) ~ Data$Z),
 risk.table = T,
 break.time.by = 12,
 risk.table.fontsize = 3,
 font.tickslab = 10,
 font.x = 11,
 xlab = 'Time (Months)',
 font.y = 11,
 font.main = 11,
 legend = c(0.8, .9),
 legend.title = '',
 risk.table.height = .20,
 risk.table.title = element_blank(),
 censor = F,
 pval = T,
 pval.coord = c(6, .00),
 pval.size = 4,
 surv.scale = 'percent',
 risk.table.y.text = F,
 palette = 'Set1'
)


