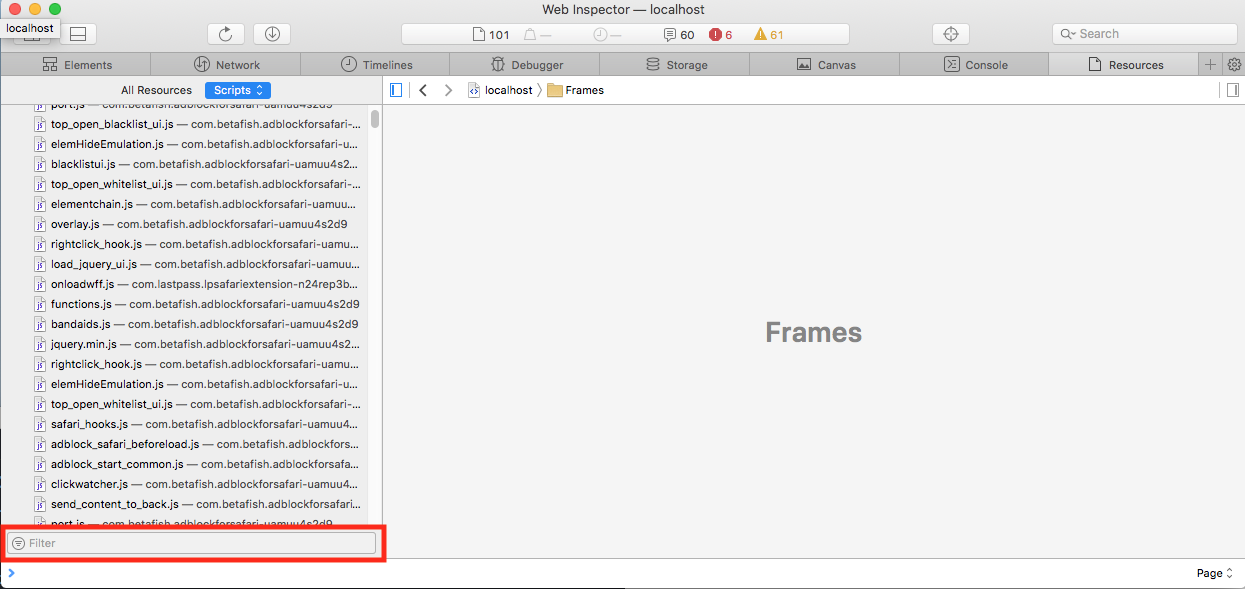
We ran into an error that only occurs on Safari browsers, so I dusted off my OSX partition on my Macbook and am trying to debug it but I can't find out how to see the original source code and set a breakpoint.
My main file is main.d7f60b0631c7822cabf3.bundle.js and the last line of the file is this, which points to the sourcemap file which does exist because I can type in the url and get it, and it works in firefox and chrome:
//# sourceMappingURL=main.d7f60b0631c7822cabf3.bundle.js.map
In Firefox I can go to the debugger tab in dev tools and under sources I see my original source file webpack:///src/app/app.component.ts and I can open it and set a breakpoint.
In Chrome dev tools I go to the 'Sources' tab and do the same thing navigating a tree to webpack:// - . - src - app - app.component.ts.
Is there a way to achieve the same thing in Safari? From memory since I"m writing this on Windows I can't see any files in the debug tab, just a list of breakpoints. In the resources tab I can see the bundle and an arrow that looks like I should be able to expand it, but clicking on that arrow does turn it from right to down like it is expanded but nothing is displayed. Other files like jquery do seem to have the original source under them when expanded...

