multiple seasonality Time series analysis in Python
Asked Answered
S

2

10

I have a daily time series dataset that I am using Python SARIMAX method to predict for future. But I do not know how to write codes in python that accounts for multiple seasonalities. As far as I know, SARIMAX takes care of only one seasonality but I want to check for weekly, monthly, and quarterly seasonalities. I know to capture day of the week seasonality, I should create 6 dummy variables, To capture day of the month seasonality, create 30 dummy variables, and To capture month of the year, create 11 dummy variables. But I don't know how to incorporate it with the main SARIMAX function in Python? I mean SARIMAX is just a function that does the autoregressive, moving average and the differencing parts but how should I include multiple seasonality codes in my time series analysis with SARIMAX? So far, I know how to create dummy variables for each category but don't know how to replicate it to the entire dataset? After that I don't know how to write Python codes that do SARIMAX and captures multiple seasonalities at the same time.

I am in need of help for Python code that can do it.

Please advise accordingly

Regards

Spectroradiometer answered 6/6, 2018 at 3:17 Comment(1)
For a more robust and flexible approach: towardsdatascience.com/…Faenza
M
5

Yes, SARIMA model is designed for dealing with a single seasonality.

Molybdous answered 6/5, 2020 at 22:26 Comment(1)
By "Fourier terms" are you refer to a partial expansion of a Fourier series?Preeminence
T
2

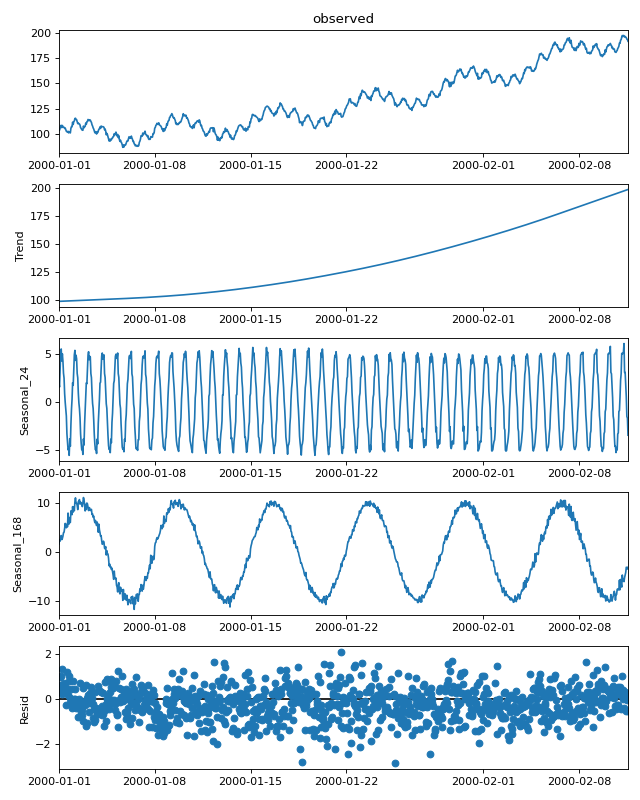
One option for handling multiple seasonalities in python is the Multiple Seasonal-Trend decomposition using LOESS (MSTL) functionality from the statsmodels package. Both MSTL function documentation and an MSTL decomposition notebook are provided.

Some example code showing decomposition of daily and weekly seasonalities:

from statsmodels.tsa.seasonal import MSTL


res = MSTL(data, periods=(24, 24 * 7)).fit()
res.plot()
plt.tight_layout()
plt.show()

enter image description here

The res object can now be used for forecasting. I believe the MSTL implementations are currently limited to additive seasonalities. There is no support for exogenous regressors.

The statsmodels MSTL function is based on the work by Rob Hyndman and co. available in the R forecast package. It uses the LOESS (locally estimated scatterplot smoothing) method.

Tensimeter answered 19/3, 2023 at 14:45 Comment(0)

© 2022 - 2024 — McMap. All rights reserved.