Using a pheatmap in arrangeGrob
Asked Answered
G

1

10

I'm attempting to plate two plots in the same .jpg using arrangeGrob(). I've only just started learning about grids and grobs and I think I know what the problem is: pheatmap is a grid object and containing grob objects, not allowing me to put it in arrangeGrob. Is this true?

Would I somehow need to put the qplot in a grid and the pheatmap in a grid and then put those grids in a new grid?

library(grid)
library(gridExtra)
library(pheatmap)
library(ggplot2)
hmdat=rbind(c(1,2,3),
            c(3,4,5),
            c(5,6,7))
hm=pheatmap(hmdat)
qp=qplot(1,1)
lm=rbind(c(1,2,2),
         c(1,2,2))
jpeg("plots.jpg")
arrangeGrob(qp,hm, layout_matrix=lm)
dev.off()

The above code snippet runs just fine when using

arrangeGrob(qp,qp, layout_matrix=lm)
Gon answered 20/9, 2016 at 9:46 Comment(2)
Try arrangeGrob(qp, hm[[4]], layout_matrix=lm). The manual page for pheatmap() clearly states in the Values section that it returns a list of components, but it fails to mention component #4, which is the gtable of the plot. You have to index it specifically since it's not going to trigger R's print method lookup/execution for that object inside the function call.Augment
That works perfectly, thanks! Any suggestion as to how I can find the solution for myself when I face this kind of problem again? Or is list value 4 being the gtable just a thing you have to somehow know? If you enter your solution as the answer, I will set the question to answered.Gon
T
8

I'm not sure if you wanted to have 6 figures or you wanted to have two figures one with twice as wide as the other one (I tried to do minimum code change):

library("grid")
library("gridExtra")
library("pheatmap")
library("ggplot2")

hmdat=rbind(c(1,2,3),
            c(3,4,5),
            c(5,6,7))

hm <- pheatmap::pheatmap(hmdat)
qp <- qplot(1,1)

lm <- rbind(c(1,2,2),
         c(1,2,2))
grid.arrange(grobs = list(qp,hm[[4]]), layout_matrix = lm)

which will give you: combination of pheatmap and ggplot in a grid

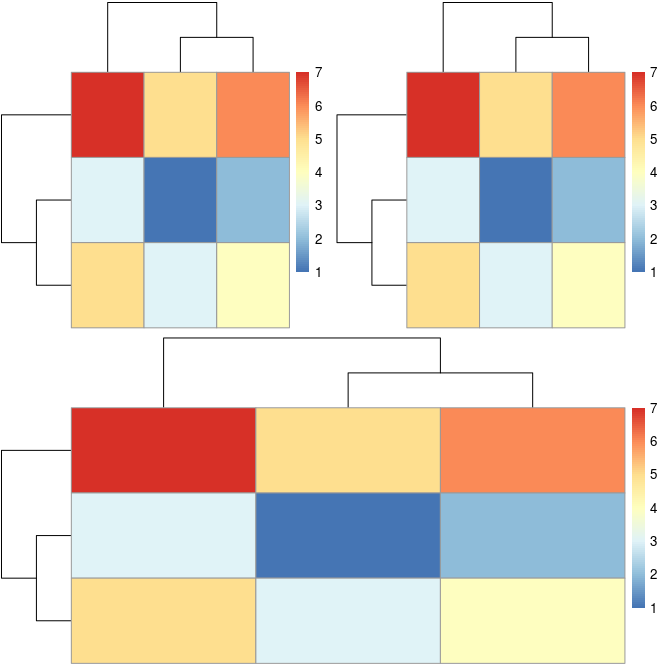
The same way you can have multiple pheatmaps side-by-side:

library("grid")
library("gridExtra")
library("pheatmap")

hmdat <- rbind(c(1,2,3),
            c(3,4,5),
            c(5,6,7))

hm <- pheatmap::pheatmap(hmdat)

lm <- rbind(c(1,2),
         c(3,3))
grid.arrange(grobs = list(hm[[4]],
                          hm[[4]],
                          hm[[4]]),
             layout_matrix = lm)

grid of pheatmap plots

As @hrbrmstr mentioned in the comment, you should use the 4th item in the pheatmap object. Also remember to provide grobs as list to the grid.arrange

Theurich answered 8/1, 2018 at 13:33 Comment(3)
Getting this error this S4 class is not subsettableFou
@hirak-sarkar I just tried it with R version 4.1.0, pheatmap_1.0.12 and gridExtra_2.3 and it worked just fine. Also I double checked the str(hm) and is.list(hm) and confirmed that the object is in fact S3. I don't know where you got the S4 ! Please double check your versions and objects.Theurich
Ok I figured, there are two pheatmap-s in my session pheatmap::pheatmap is the correct one. There was also another from ComplexHeatmap.Fou

© 2022 - 2025 — McMap. All rights reserved.