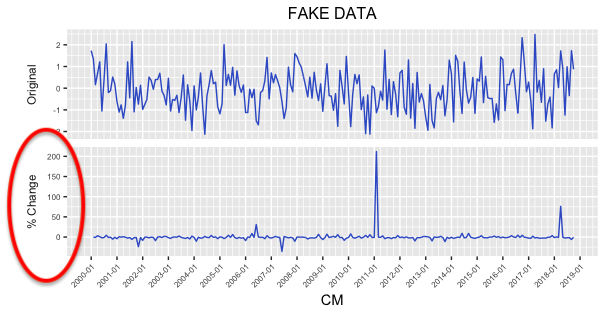
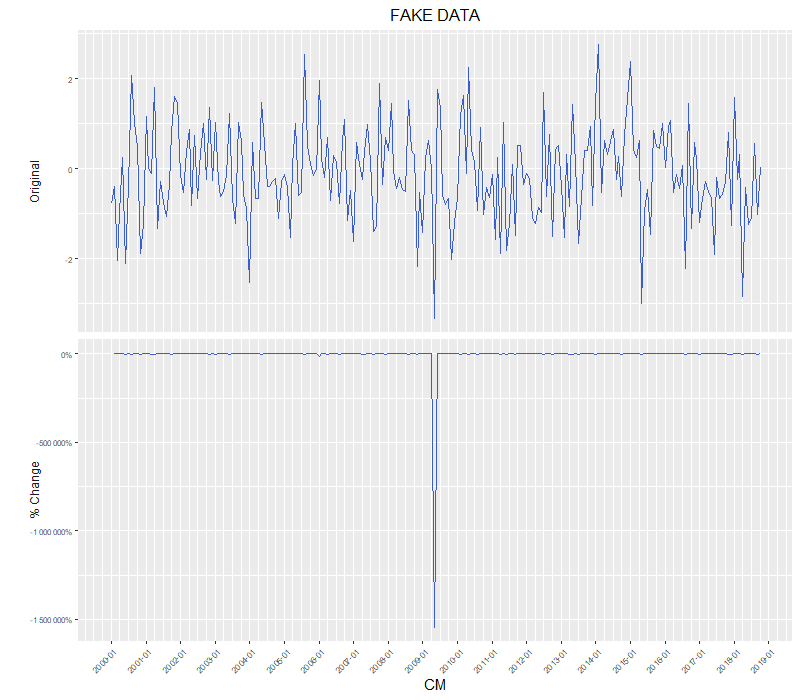
I'm plotting a time series value with its percentages using facet_wrap in ggplot:
For the plot below, the upper plot is the value, and the lower plot is percentage change. And I would like the y-axis in the lower plot to be "%". Normally in ggplot I would do something like
+ scale_y_continuous(labels = scales::percent)
But since I'm using facet_wrap, how do I specify that I only want one of the 2 plots' y-axis label to be percentages?
P.S. Here is the code to generate this plot:
library(data.table)
library(ggplot2)
library(scales)
library(dplyr)

pct <- function(x) {x/lag(x)-1}
Dates = seq(from = as.Date("2000-01-01"),
            to =as.Date("2018-10-01"),
            by = "1 month")
set.seed(1024)
this_raw = data.frame(CM = Dates,
                      value = rnorm(n = length(Dates)),
                      variable = rep("FAKE",length(Dates)))
this_diff = na.omit(as.data.table(this_raw %>%
                                    group_by(variable) %>%
                                    mutate_each(funs(pct), c(value))))
this_diff$type = "PerCng"
this_raw$type = "RAW"
plot_all = rbindlist(list(this_raw,this_diff))
plot_all$type = factor(plot_all$type, levels = c("RAW", "PerCng"))

out_gg = plot_all %>%
  ggplot(aes(x=CM, y=value)) +
  geom_line(color = "royalblue3") +
  theme(legend.position='bottom')+
  ggtitle("FAKE DATA") +
  facet_wrap(~ type, scale = "free_y", nrow = 2,
             strip.position = "left",
             labeller = as_labeller(c(RAW = "Original", PerCng = "% Change") ) )+
  scale_x_date(date_breaks = "12 month", date_labels = "%Y-%m",
               date_minor_breaks = "3 month")+
  ylab("")+
  theme(plot.title = element_text(hjust = 0.5,size = 12),
        axis.text.x = element_text(size = 6,angle = 45, hjust = 1),
        axis.text.y = element_text(size = 6),
        axis.title.y = element_text(size = 6)) +
  theme(strip.background = element_blank(),
        strip.placement = "outside")+
  theme(legend.title=element_blank())
print(out_gg)


